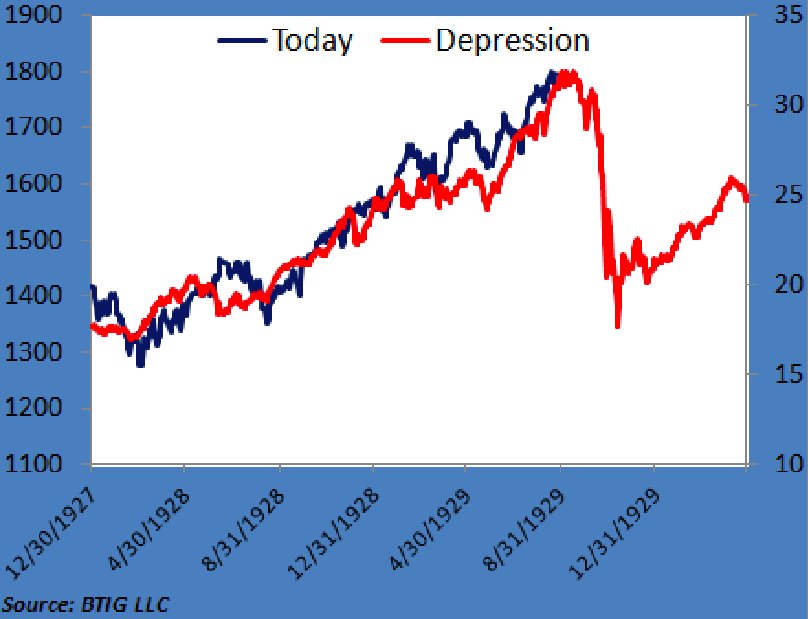
The 2013 stock market’s bull
run appears to be following the almost identical trajectory of the stock
market in 1929 before the great crash, which led to the Great
Depression.
December 30, 2013 – FINANCE- It
is time to crank up the Looney Tunes theme song because Wall Street has
officially entered crazytown territory. Stocks just keep going higher
and higher, and at this point what is happening in the stock market does
not bear any resemblance to what is going on in the overall economy
whatsoever. So how long can this irrational state of affairs possibly
continue? Stocks seem to go up no matter what happens. If there is good
news, stocks go up. If there is bad news, stocks go up. If there is no
news, stocks go up. On Thursday, the day after Christmas, the Dow was up
another 122 points to another new all-time record high. In fact, the
Dow has had an astonishing 50 record high closes this year. This reminds
me of the kind of euphoria that we witnessed during the peak of the
housing bubble. At the time, housing prices just kept going higher and
higher and everyone rushed to buy before they were “priced out of the
market.” But we all know how that ended, and this stock market bubble is
headed for a similar ending. It is almost as if Wall Street has not
learned any lessons from the last two major stock market crashes at
all. Just look at Twitter. At the current price, Twitter is supposedly
worth 40.7 BILLION dollars. But Twitter is not profitable. It is a
seven-year-old company that has never made a single dollar of profit.
In fact,
Twitter actually lost 64.6 million dollars last quarter alone. And
Twitter is expected to continue losing money for all of 2015 as well.
But Twitter stock is up 82 percent over the last 30 days, and nobody can
really give a rational reason for why this is happening. Overall, the
Dow is up more than 25 percent so far this year. Unless something really
weird happens over the next few days, it will be the best year for the
Dow since 1996. It has been a wonderful run for Wall
Street. Unfortunately, there are a whole host of signs that we have
entered very dangerous territory. The median price-to-earnings ratio on
the S&P 500 has reached an all-time record high, and margin debt at
the New York Stock Exchange has reached a level that we have never seen
before. In other words, stocks are massively overpriced and people have
been borrowing huge amounts of money to buy stocks. These are behaviors
that we also saw just before the last two stock market bubbles burst.
And of course the most troubling sign is that even as the stock market
soars to unprecedented heights, the state of the overall U.S. economy is
actually getting worse…
-During the last full week before
Christmas, U.S. store visits were 21 percent lower than a year earlier
and retail sales were 3.1 percent lower than a year earlier. -The number
of mortgage applications just hit a new 13 year low. -The yield on 10
year U.S. Treasuries just hit 3 percent. For many more signs like this,
please see my previous article entitled “37 Reasons Why ‘The Economic
Recovery Of 2013′ Is A Giant Lie.” And most Americans don’t realize
this, but the U.S. financial system and the overall U.S. economy are now
in much weaker condition than they were the last time we had a major
financial crash back in 2008. Employment is at a much lower level than
it was back then and our banking system is much more vulnerable than it
was back then. Just before the last financial crash, the U.S. national
debt was sitting at about 10 trillion dollars, but today it has risen to
more than 17.2 trillion dollars. The following excerpt from a recent
article posted on thedailycrux.com contains even more facts and figures
which show how our “balance sheet numbers” continue to get even worse… –Economic Collapse
 In fact,
Twitter actually lost 64.6 million dollars last quarter alone. And
Twitter is expected to continue losing money for all of 2015 as well.
But Twitter stock is up 82 percent over the last 30 days, and nobody can
really give a rational reason for why this is happening. Overall, the
Dow is up more than 25 percent so far this year. Unless something really
weird happens over the next few days, it will be the best year for the
Dow since 1996. It has been a wonderful run for Wall
Street. Unfortunately, there are a whole host of signs that we have
entered very dangerous territory. The median price-to-earnings ratio on
the S&P 500 has reached an all-time record high, and margin debt at
the New York Stock Exchange has reached a level that we have never seen
before. In other words, stocks are massively overpriced and people have
been borrowing huge amounts of money to buy stocks. These are behaviors
that we also saw just before the last two stock market bubbles burst.
And of course the most troubling sign is that even as the stock market
soars to unprecedented heights, the state of the overall U.S. economy is
actually getting worse…
In fact,
Twitter actually lost 64.6 million dollars last quarter alone. And
Twitter is expected to continue losing money for all of 2015 as well.
But Twitter stock is up 82 percent over the last 30 days, and nobody can
really give a rational reason for why this is happening. Overall, the
Dow is up more than 25 percent so far this year. Unless something really
weird happens over the next few days, it will be the best year for the
Dow since 1996. It has been a wonderful run for Wall
Street. Unfortunately, there are a whole host of signs that we have
entered very dangerous territory. The median price-to-earnings ratio on
the S&P 500 has reached an all-time record high, and margin debt at
the New York Stock Exchange has reached a level that we have never seen
before. In other words, stocks are massively overpriced and people have
been borrowing huge amounts of money to buy stocks. These are behaviors
that we also saw just before the last two stock market bubbles burst.
And of course the most troubling sign is that even as the stock market
soars to unprecedented heights, the state of the overall U.S. economy is
actually getting worse…
No comments:
Post a Comment