Submitted by Tyler Durden on 03/17/2016 11:22 -0400 http://www.zerohedge.com/news/2016-03-17/why-yellen-went-full-dove-us-hiring-plunges-most-november-2008 While the BLS' JOLTs report usually gets a
B-grade in terms of importance due to its one-month delayed look back
(we just got the January report which
is one month behind the most recent payrolls number) it serves an
important function due to its breakdown of various labor components such
a job openings, new hires, separations, quits and terminations, all of
which make up Janet Yellen's "labor dashboard." In fact, according to
Yellen herself, the JOLTs data is as important, if not more so, than the
BLS report.
Which may explain why yesterday the Fed surprised as dovishly as it did.
As a reminder, the key number most look for in the monthly JOLTs
report is the number of Job Openings: for January the BLS reported a
print of 5,541K, which modestly beat the expected 5,500K consensus
number.
However, it wasn't the January number that was the problem, but last
month's print, which was then reported at 5,607 and in the latest series
was revised to 5,281, a downward revision of 326K. What will be
concerning to Yellen - who certainly had these numbers in advance - is
that as the chart below shows, this was the biggest downward revision to
job openings in series history.
Additionally if one adds the December and November revisions
together, the result of -474K is the biggest two-month cut to openings
since December 2006.
Another notable disappointment in January was the plunge in the quits
level: also known as the "take this job and shove it" indicator, higher
"quits" levels (as opposed to discharges or terminations which barely
moved in January) suggest workers are confident about job prospects, and
vice versa - a drop in quite implies workers are more fearful of the
labor market and unwilling to tell their employer they are out.
According to the BLS, in January the Quits number dropped by 284K to
2,804K, after breaking out last month. This was the single biggest
monthly drop since the financial crisis.
But while the revisions could be ignored, and the quits rate is at
best a tertiary indicator, one data series that certainly caught
Yellen's attention was the number of January "hires", because as shown in the chart below, with
a print of 5,029K in January, this was a whopping 372K drop from the
December 5,401K, which also happens to be the biggest single monthly
drop in new hiring since November 2008!
In fact, the total number of hires in January 2016 was 23K lower than
the 5,052K hired one year ago in January 2015, hardly confirmation of a
growing labor market.
This dramatic drop is best seen when showing the two complimentary
series of 12 month cumulative changes in payrolls (which has been
rolling over ever since February 2015 when it peaked at 3.2 million and
is now down to 2.5 million as payrolls have clearly slowed down), and
the monthly hiring change. One look at the chart below and one can't
help but wonder if the December spike was the labor market top and the
rollover in hiring now confirms that the US labor market is set for a
slow, or not so slow, contraction in the coming months.
We wonder how much of the above was instrumental in Yellen finally
admitting the Fed was at least 50% wrong in just three months the FOMC
cut the number of expected 2016 rate hikes from 4 to 2.
Here’s a newsflash that CNBC didn’t mention. According to the BLS, the US economy generated aminiscule 11,000 jobsin the month of December.
Yet notwithstanding the fact that almost nobody works outside any more, the BLS fiction writers added 281,000 to their headline number to cover the “seasonal adjustment.” This is done on the apparent truism that December is generally colder than November and that workers get holiday vacations.
Of course, this December was much warmer, not colder, than average. And that’s not the only deviation from normal seasonal trends.
The Christmas selling season this year, for example, was absolutely not comparable to the ghosts of Christmas past. Bricks and mortar retail is in turmoil and in secular decline due to Amazon and its e-commerce ilk, and this trend is accelerating by the year.
So too, energy and export based sectors have been thrown for a loop in the last few months by a surging dollar and collapsing commodity prices. Likewise, construction activity has been so weak in this cycle—-and for the good reason that both commercial and residential stock is vastly overbuilt owing to two decades of cheap credit—–that its not remotely comparable to historic patterns.
Never mind. The BLS always adds the same big dollop of jobs to the December establishment survey come hell or high water. In fact, the seasonal adjustment has averaged 320,000 for the last 12 years!
For crying out loud, folks, every December is different—–and not just because of the vagaries of the weather. Capitalism is about incessant change and reallocation of economic activity and resources. And now the globalized ebbs and flows of economic activity have only accentuated the rate and intensity of these adjustments.
Yet the statistical wizards at the BLS think they can approximate a seasonal adjustment factor for December that at +/- 300k amounts to just 0.2% of the currently reported 144.2 million establishment survey jobs, and an even smaller fraction of the potential adult work force which is at least 165 million.
But that’s a pretentious stab in the dark. The December seasonal adjustment (SA) could just as easily be 0.3% of the job base or 0.1%, depending upon the specific point in the business cycle and structural trends roiling the economy.
Indeed, these brackets alone would vary the headline SA number by 150k to 450k. The fact that the seasonal adjustment factor for December has oscillated tightly around 300,000 for the last 12 years proves only one thing—–namely, that the bureaucrats at the BLS have chosen to invent the same guesstimate year after year; its not science, its political fiction.
The fact is, the seasonal adjustment factors are about the closest thing there is to pure noise among all the dubious “incoming” data that the Fed and Wall Street obsess over.
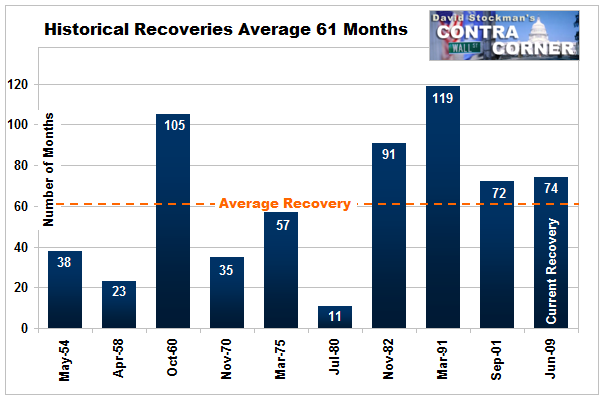
Here’s a better take on the matter. We are now in the 78th month since the June 2009 recession bottom, and are reaching the point where this so-called business cycle expansion is getting very long in the tooth by all historical standards.
Historical Length of Recoveries
So what happened to the non-seasonally adjusted (NSA) job count in December at similar points late in the course of prior cycles? Well, in December 1999 about 140,000jobs were added and in December 2007 there was a NSA gain of 212,000. This time we got the magnificent sum of 11,000, and by the way, last year was only 6,000.
The real news flash in the December “jobs” report, therefore, is that even by the lights of the BLS’ rickety, archaic and virtually worthless establishment survey, the domestic economy is dead in the water. We are not on the verge of “escape velocity”, as our foolish monetary politburo keeps insisting; the US economy is actually knocking on the door of recession.
And that’s why the retail sheep have been led to the slaughter once again in the Wall Street casino. The cats who run it have embraced the nonfarm payroll report as the primo macroeconomic indicator because they know that it drastically lags the real drivers of main street activity and has an abysmal record of forecasting turns in the macroeconomic cycle.
Stated differently, these fictional monthly SA jobs numbers are extremely useful to the Wall Street sell side. They keep the rubes hitting the “buy” button until the fast money can slowly dump its holdings and get out of Dodge; or even pivot and reload to the short side.
That’s right. We are not talking tin foil hats here. It is plain as day that the BLS’ seasonal adjustments are a completely stupid waste of time. During the winter season especially, it might as well just use a random numbers generator.
Indeed, here’s what the Steve Liesman’s of the world never tell you—–undoubtedly because they don’t know. Fully two-thirds or 200,000 of the 300,000 December seasonal adjustment is in the construction sector!
So the whole December SA is essentially a weather proxy designed to adjust a survey taken during the middle week of the first month of winter. Could weather fluctuations impact the number of construction workers on the job by a mere 2% (150,000) around the week of December 15?
Well, yes it could. And that means we really don’t know whether 292,000 “jobs” were created in December or whether it was only 142,000.
Once again, loose the SA noise in the construction sector job count. This category alone accounted for 45,000 of the headline gain, but that was owing to the fact that the 6.538 million figure reported for the construction category was flattered by a 196,000 seasonal adjustment.
Instead, look at the non-seasonally adjusted (NSA) number compared to the same point in the cycle from prior history. Thus, at the December 2006 peak the number of construction jobs was 7.585 million, meaning we are still down by 1.1 million jobs or 15% from the prior cycle high.
And in December 2000, there were actually 6.7 million construction jobs. That is, we have not yet returned to the cyclically comparable level that prevailed at the turn of the century.
In short, the December jobs report was not evidence of a “strong” economy. It was just another emission from the government’s SA noise factory that obscures the actual state of the main street economy.
So here’s the real truth. Construction jobs are breadwinner jobs. The average annualized pay rate for the category is $57,000, but the US economy is not actually generating new construction jobs any longer.
What’s happening is that the BLS is simply reporting “born again” jobs and thereby enabling the Keynesian chorus to claim “progress” and “strength”, and for its Wall Street section to blather about “blow-out numbers”. Indeed, the latter has embraced the Keynesian model lock, stock and barrel precisely because its so useful in the stock peddling business.
The Keynesian model is about deltas, not levels. For reasons we will amplify below that’s almost always misleading in the context of monetary central planning and the bubble finance cycles that flow from it.
In fact, the only valid measure of economic strength and the main stream economy’s capacity to support sustainable profit growth and higher stock prices is the change in levels over time at cyclically comparable points.
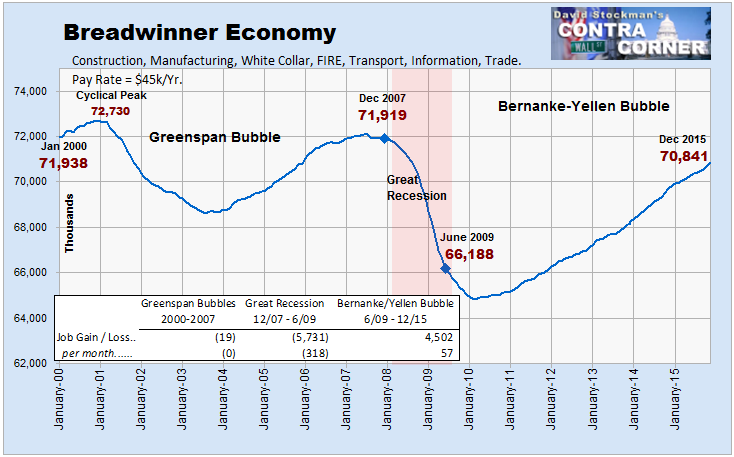
That gets us to the larger story embedded in the above observations about the construction sector jobs series. Namely, just as there have been no trend gains in the level of construction jobs since the turn of the century, the same is true of the much wider swath of what we have called “breadwinner jobs”.
These jobs in construction, energy and minerals, manufacturing, FIRE, the white collar professions, business management, information technology and trade/distribution account for 50% of all nonfarm payroll slots, pay upwards of $50,000 per year on average and account for more than 66% of total wage and salary disbursements.
Yet the December 2015 number of breadwinner jobs was still 1.1 million jobs below that posted for the first month of this century!
Needless to say, that’s not “strength”. It’s actually a profound indictment of the archaic convention embedded in the monthly employment report that counts job slots,not the variable gigs and hours on which employment in the contemporary US economy is actually based.
Indeed, all the Jobs Friday hoopla is based on your grandfather’s BLS survey, which arose at a time when everyone punched the clock at the Ford factory 40-50 hours per week, including overtime. By contrast, now the greeters and cash register operators at Wal-Mart are computer-scheduled in 15 minute increments.
Since average pay for the bartenders and waiters category is less than $20,000 on an annualized basis owing to an average of 26 hours per week and $13/hour pay rates, you need 2.5 of these gigs to get the equivalent of one breadwinner job. Yet on Jobs Friday its all one job, one vote.
So what is actually happening beneath the surface is a great swap out. The very highest productivity jobs in goods production are disappearing on a trend basis; the monthly deltas reported so breathlessly on bubble vision actually embody purely “born again” employment slots that represent the partial recovery of jobs lost during each crash of the Fed’s serial financial bubbles.
But the cyclically adjusted trend is down, not up. It represents economic weakness and reduced capacity to generate productivity, income and profits, not strength.
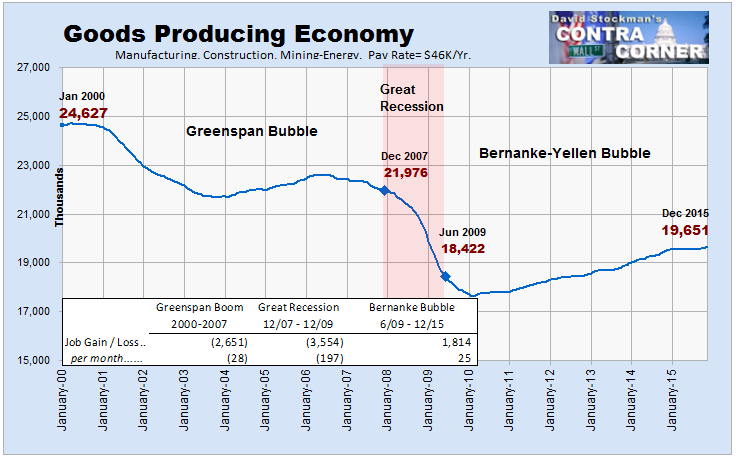
In fact, not withstanding the “blow-out” December numbers, the US economy still has 11% fewer jobs in goods production—-mining, energy, manufacturing and construction—–than it did at the December 2007 cyclical peak, and 21% fewer than at the turn of the century.
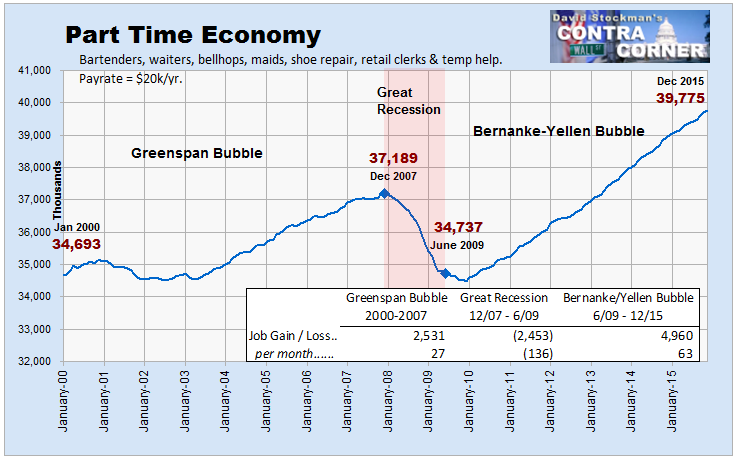
By contrast, what is being swapped in are what we have called Part-Time Economy jobs, where there have been modest cyclically comparable gains in job levels during the past 15 years. Needless to say, however, the average annualized pay rate in this category is less than $20,000.
But even these trend level gains are heavily concentrated in the lowest quality quadrant. That is, in what we have called the “Bread and Circuses Economy”—–bartenders, waiters, bellhops, maids, parking attendants, hot dog vendors and the like.
The fact is, this category accounts for full 70%, or 1.8 million, of the 2.59 million gain in Part Time Economy jobs since the pre-recession peak in December 2007.
Another factor obscured by the BLS’ archaic job slot counting convention is the root wealth and productivity contribution of the job count at any point in time. Generally, private sector jobs financed by consumers add to wealth and productivity at varying degrees, depending on the sector.
By contrast, taxpayer financed jobs—–directly through government outlays or indirectly through heavy tax subsidies and preferences—–do not add to wealth, and, not to put too fine a point on it, may well subtract from it. And that gets us to the HES Complex (health, education and social services).
This is the fastest growing job category since the turn of the century, yet it now depends upon more than $2 trillion per year of Medicare, Medicaid and other government health spending—–plus another $250 billion or so of tax expenditures for employer health plans and tax credits for education.
Yes, it can be argued that a some part of the current 32.6 million jobs in the HES Complex add to long-run productivity via education and health status improvement of the working age population. But that point does not get you too far if you recognize the abject and worsening failure of public education in the US and the gross inefficiency of our third-party payment dominated health care system.
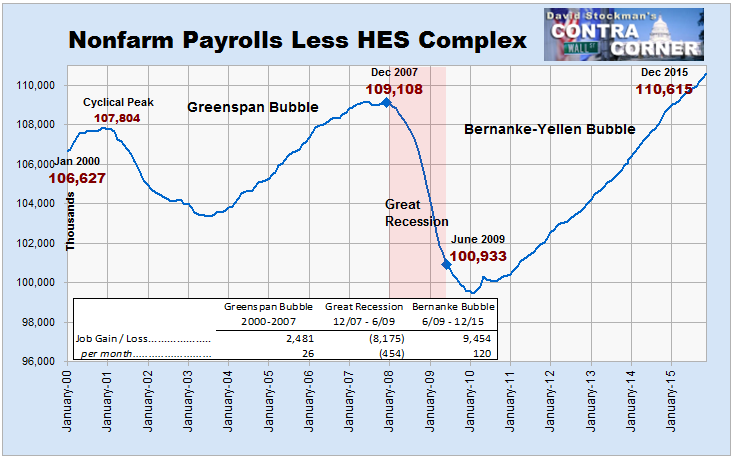
Far more relevant is this fact. For the entirety of this century there has been only a 3.7% net gain in even the gross number of job slots in the US economy outside of the HES Complex, and that measurement includes the Part Time Economy and its Bread and Circuses subset.
Stated differently, on a trend level basis, the US economy has only generated 21,000 jobs per month over the last 15 years that were not funded by the public fisc, and therefore indirectly by the $10 trillion gain in public sector debts since the turn of the century.
So whatever is embedded in the BLS payroll count, don’t call it recovery, strength or progress. Instead, call it a propaganda cloud that serves the interests of Wall Street and the monetary central planners, alike.
Here’s the thing. You can not sell stock if you tell customers that a recession is coming and earnings are going to be heading sharply in a southerly direction. So Wall Street never does.
By the spring of 2008, for example, after the subprime mortgage implosion was already well underway, Countrywide Financial had already failed, AIG was hitting the rocks, Bear Stearns was gone, and housing sales and starts were sliding rapidly from their towering peaks, the Wall Street consensus ex-items hockey stick still pointed to S&P earnings of $115 per share.
As it happened, the actual result was $15 per share. And the homegamers who stayed in the market on that assurance were treated, instead, to a bloodbath in which they lost trillions in the 401k and brokerage accounts.
Likewise, the monetary central planners at the Fed and their economist cheerleaders have never forecast a recession. That’s because they embrace the cardinal Keynesian Error, which holds that private capitalism is inherently unstable and prone to extreme cyclical swings—-even a tendency toward depressionary black holes.
So they assume that their policy tools and maneuvers are not only doing gods work of keeping private capitalism on the straight and narrow. Indeed, the arrogant and foolish professor from Princeton, Ben Bernanke, called it The Great Moderation in March 2004 just as the greatest bubble and bust in modern history was working up a head of steam.
Notwithstanding the thumping repudiation of that conceit which occurred during the great financial crisis and recession, the predicate remains that this time is different. To wit, the monetary central planners now have it right and will steer the US economy deftly to the nirvana of permanent Full Employment, world without end.
Nervously sitting in the WorkSource office in downtown Seattle,
a slip of paper with my number rapidly yellowing with sweat clenched
between my fingers, a man in filthy jeans and mismatched shoes turned to
me and asked what I was doing there.
“You don’t look poor enough to be here,” he told me.
He was right. I didn’t. Because what we collectively think of as “looking poor” does not, in fact, encompass the real face of poverty
in this country. As a white, 22-year-old college graduate in a
second-hand dress, I did not look like what we think of as “poor.”
Of course, at that exact moment, I had, yes, a college degree and a coveted unpaid (because, of course, it was unpaid) internship at a public radio station. But I also had a minimum wage
job to support myself, $17 in my bank account, $65,000 in debt to my
name, and $800 in rent due in 24 days. I was extremely hungry, worried
about my utilities being shut off, and 100 percent planning to hit up
the dumpster at the nearby Starbucks
when I was done there. I had no functional stove in my tiny apartment
because the gas it took to make it work was, at $10 per month, too
expensive. I was at WorkSource to find out if I qualified for literally
any program to make my finances less crushing.
I had, like millions of other working Americans and many, many millennials, no financial safety net.
In the United States, approximately 15 percent of residents live below the poverty line and another 10.4 million are considered “the working poor.” And yet, we have very, very concrete—and very incorrect—perceptions about how poverty actually looks. And it does not look like millennial college grads. So we kind of keep ignoring it.
The
disconnect is simple: Poverty doesn’t look the way we think it looks,
so we don’t think people who are, in fact, poor “look poor,” so we
assume that poverty isn’t really that bad. We also assume that by taking
steps that have traditionally been associated with improved economy
status, it will get better.
We are now seeing that it might not.
Through college debt, we are minting a new generation of people with less opportunity, rather than more
Even if you glossed right over the teachings of Thomas Piketty,
you probably know that those who start out poor are more likely to stay
poor. When you are constantly fighting your way up from zero (or
negative), you tend to stay that way. And when education
is supposed to be the path out, if it leads to more debt, it’s more
cyclical than linear. New grads no longer start from zero—they start
with a negative balance.
Consider what we’re setting up for our
future by thinking about poverty in terms of how it should be, and not
how it is. We are pushing education on everyone, then punishing
education and the pursuit of a higher income with so much debt that
there is no way to win.
There is an assumption about college students that, when they graduate,
they will be permitted a small amount of time to get back on their feet
by moving home with their parents. With no small amount of contempt, we
refer to these people as “boomerang kids.”
However, just as is the case with almost everything, ever, the
ability to move back home—to take an unpaid internship without batting
an eye—is, in and of itself, a huge privilege. And it is a privilege
that begets other privileges.
In 2012, nearly half of American households were just one emergency away from poverty or homelessness. Most Americans don’t have the savings for literally one—one—unexpected bill. There are more individuals considered “the working poor” than there are who are not considered as such. Over 1.5 million individuals were
estimated to have been homeless at some point in 2014. In a country
where people never agree on a damn thing, nearly three-quarters of
people can agree on the sentiment that the poor are getting poorer.
They aren’t just getting poorer, though. We are making them poorer.
In the U.S., about a third of college students are
first-generation attendees, meaning their parents did not go to
college. That percentage is much higher among people of color. Many of
them—and even many students whose parents did go to college, but it’s
worse for first-gen students—don’t have the ability to move home after
college, either because:
A) Their parents don’t have the means to support them
B) Their parents live in impoverished areas where, if they were to move home, they would be unable to find work.
OR
C) Some combination of the two.
Or, possibly, D) Maybe they are one of the 20,000 kids who age out of foster care each year and there is just nowhere else for them to go.
But
for many of those first-gen college students (and students whose
parents, too, are considered the “working poor” but might even have some
college), graduation puts them worse off than they were before. The
idea that there is a safety net—that boomeranging is the norm—is just
not true, and it is detrimental.
Saddled with student loans they statistically will not be able to pay off for at least a decade (the average debt is about $30,000; the average income for a recent new grad is only about $44,000, and the unemployment rate hovers around 8.5 percent),
which are due every month on top of rent and other expenses, many
college graduates are worse off than they would have been if they’d
directly entered the workforce debt-free. More college students live in
poverty—actual poverty, not just
“can’t-afford-pizza-better-call-the-parents” brokeness—than the overall population. One in five millennials is considered “in poverty” today, up from one in eight in 1980.
The cycle is predatory. From the Boston Globe, reporting on a study released by Crittenton Women’s Union:
The
study, based on a survey of more than 100 low-income individuals, found
that most of the debts resulted from stretches of unemployment, medical
costs, and student loans. The study also found that poor people are
often overwhelmed by high interest rates that make it nearly impossible
to pay down debts, then penalized again when prospective employers or
landlords conduct credit checks before hiring or renting to them.
And the prospects are not improving. Because as income increases for college grads (58 percent of millennials will
receive a bachelor’s degree), so does the cost of living. So do
interest rates. So does the rent. So do home prices. So does the cost of
doing literally everything.
“Good” jobs—those jobs you need a degree for—still don’t pay the bills. More new college grads use food stamps than ever before; in fact, the demand has doubled. And while millennials are arguably facing the brunt of it, it doesn’t end there; even seniors are being hit by lingering student debt.
So what do we do? Make college more affordable? Free, even? Nope, say some. That won’t work, either.
Earlier this year, President Obama floated the idea of offering two free years of community college to anyone; critics immediately raised their fingers to
point out that if that happens, some people of means might take
advantage of that offering. Or that maybe a college education isn’t even worth that much, anyway, so why go into deeper national debt to provide one to everyone?
When education is
supposed to be the path out, if it leads to more debt, it’s more
cyclical than linear. New grads no longer start from zero—they start
with a negative balance.
Almost no solution for this problem seems to please anyone—and almost all of them that do have some kind of bipartisan support rely on already having access to money and resources or settling for an education that could put you at a disadvantage (something I’ve written about before).
And
yet, when most people think about poverty, they think something else.
Maybe they think about a homeless man begging for change. Maybe they
think of the “welfare queen,” who bilks the government for money (when,
of course, it is actually the wealthiest who
take the most). Maybe they think about a family that looked a lot like
mine did growing up (one provider, too many kids, receiving WIC and food
stamps and every other kind of assistance we could and even then still
living precariously close to poverty).
Most likely, they imagine
brown faces. Because don’t forget, part of what a lot of people mean
what they talk about what poverty looks like is a statement on and race
in America. When the man at WorkSource told me I didn’t “look poor
enough,” my whiteness was probably a big part of that sentiment.
And
that is also inaccurate. Which is not to say that people of color (and
especially millennials of color) don’t experience disproportionate
unemployment—they do—but it is to say that poverty is an everybody issue.
“As it turns out, our deeply racialized view of poverty bears no resemblance to reality,” wrote Leonard Pitts, Jr. for the Miami Heraldlast
year. “Though it’s true that African Americans are disproportionately
likely to live below the poverty line, it is also true that the vast
majority of those in poverty are white: 29.8 million people. In fact,
there are more white poor than all other poor combined.”
Still,
the ongoing challenges that face millennials of color are real. They
face more and different struggles than white millennials when it comes
to even getting into college. Higher high school dropout rates, disproportionate rates of incarceration, and other factors all contribute to the difficulty of even making it to college. The paths to college for white and non-white millennials are very different. But to what end?
Often, college graduation rates among people of color are hailed as proof that thing are getting better (which, in some cases, is actually pretty hopeful), because, while millennials are seeing some closure in the race gap, graduation rates are still pretty unequal.
The
prospects are not improving. Because as income increases for college
grads (58 percent of millennials will receive a bachelor’s degree), so
does the cost of living.
Except that graduation is still
not a guarantee of wealth, success, or even improved economy status. We
should forget about the gender pay gap, which starts basically right after women—yes, even women in STEM—get their diplomas.
Whatever poverty looks like to the general population, it is clearly not very sympathetic; most people don’t think that the government should provide more assistance than they currently are. In a 2012 poll, the majority of Americans surveyed said they thought welfare is being abused by those who rely on it. And our lawmakers continue to make it harder to bail ourselves out, blocking bills that would help make education less bank-breaking.
But we also, collectively, tend to agree that
poor people do not face an even playing field and that the roots of
poverty are systemic, not a result of laziness or failings by those who
are poor. We support raising the minimum wage because the plain fact is that life is more expensive now than it was 10, 30, or 50 years ago, and the idea that everyone should be able to rise above the minimum is just not realistic.
I
have been poor more than I have been not-poor. I grew up poor. I went
to a university (something that neither of my parents did, through
choice, circumstance, and a systemic series of beliefs about who college
is for) to no longer be poor, because I believed, as I was told by
guidance counselors and the media and many adults and colleges
themselves, that that was the only way to be not-poor.
And yet,
going to college made me, at least in the years since I’ve graduated,
more poor. I was more financially strained than I ever could have
imagined, more crushed by the persistent weight of debt, and more driven
by income than almost anything else. This is not about a lack of fiscal
responsibility; this is the fallout of a culture that says there is
only one way to get ahead, and that way is a treacherous one.
When
we talk about millennials, we can’t not talk about the debt that keeps
us reigned in, and the difficulty in getting out of it.
We
don’t look poor. I don’t look poor. And most often, I find it too
uncomfortable to talk about how really easy it is to be poor, even when
you’re working and you went to college and you are doing everything
right.
So I have to wonder: What if we stopped trying to decide who was poor
based on appearance and actually looked at the financials of those who
were scraping by? What if we calculated poverty not based on those who
were literally already homeless (though to be honest we do a shit job of
that, too), but rather based on everyone who is one missed shift away
from being completely out of money and options?
What if
people with resources—people who went to college at a time when they
could pay for college without mountains of debt, or people whose parents
were fortunate enough to be able to save for them, on their
behalf—stopped chiding those without for their perceived poor decisions
and instead decided to actually address the problem, which is that this
is an economic climate wherein it is damn near impossible to get out of
poverty?
When we talk about
millennials, we can’t not talk about the debt that keeps us reigned in,
and the difficulty in getting out of it.
What if we
acknowledged that there are more poor people than we realize and that
even doing literally everything prescribed by those with wealth does not
guarantee wealth?
What if we stopped wringing our hands about the death of the middle class and did something to attempt to resuscitate it?
To
this day, I don’t “look poor.” I have a nice apartment, the right kind
of job, clothes that don’t look like I bought them all on clearance
years ago. But don’t let my appearance fool you—I’m that millennial who is ruining the economy with my choices.
I
don’t own a vehicle, and I likely won’t be anywhere near able to afford
homeownership until I’m well into my 30s (no matter how many people
tell me it’s “actually not that hard” to get together a down payment) in
no small part because I started my path to adulthood, as I was told to
do, at a five-figure deficit. And frequently, at the end of a pay
period, after paying rent and another $600 in student loans for the
privilege of becoming the first in my family to graduate from college,
I’m right back to being one unforeseen expense away from an overdraw.
I don’t look poor—most of us don’t—but that doesn’t mean a whole lot. This article originally appeared on Medium and was reposted with permission. Hanna
Brooks Olsen is a writer, small human, and a millennial. Her interests
are politics, podcasts, Pac-12 football, feminism, and Oxford commas.
She is curious to a fault.
Google chairman, Eric Schmidt, has warned the jobs problem will be "the defining one" for the next two-three decades.
He said given the constant development of new technology, more and more middle class workers would lose their jobs.
Speaking at a meeting at the World Economic Forum at Davos,
he added that it was not clear if workers would have the right skills to
be re-hired.
Mr Schmidt compared the situation to the industrial revolution.
He called for more industry-wide innovation.
"It's a race between computers and people - and people need to win," he said. Redefining
The one-time chief executive of Google said that there was an
enormous amount of innovation happening, and it would be an economic
mistake to delay adopting efficient new technologies.
He pointed out that, on a net basis, more jobs were created
by small companies and therefore entrepreneurs needed more support
otherwise the situation would get worse.
"It's clear to me that we can get full employment, but wages are still depressed," Mr Schmidt told the forum.
"As more routine tasks are automated, this will lead to much
more part-time work in caring and creative industries. The classic 9-5
job will be redefined," he said.
On the subject of privacy, Mr Schmidt said at "least we're having a debate now".
He added: "This is a luxury problem. The majority of people do not live in democracies and do not trust their government.
"It's not a debate they're having. For them, the ability to
use the internet totally overwhelms their fear of how the government
uses it."
Friday, December 6, 2013
Ikea's Spanish Servers Crash When 20,000 People Apply For 400 Jobs
Submitted by Tyler Durden on 12/06/2013 17:29 -0500
A few years back, we were stunned when we reported that as a result of McDonalds' first hiring day in 2011, the company retained the services of 62,000 very qualified line cooks and other minimum wage workers. What was stunning is that one million Americans applied for these jobs, or a 6.2% success rate, or just a fraction above the5.8% admission rate at Harvard. Alas, as we speculated at the time, this was merely the first of many such indications of the historic mismatch between labor supply and demand, both domestically and globally. Sure enough, today we find an even more glaring example of just how unprecedented the New Normal demand for labor is in a world drowning with unemployment, courtesy of an NPR report according to which on Monday, Spain's Ikea's started taking applications for 400 jobs at a new megastore set to be opened near the Mediterranean coast town of Valencia.
As NPR says, "The company wasn't prepared for what came next. Within 48 hours, more than 20,000 people had applied online for those 400 jobs." An "acceptance rate" of 2%.
It gets better, as Spain experienced its own mini Obamacare debacle: the sheer volume of applicants promptly "crashed Ikea's computer servers in Spain."
"We had an avalanche of applicants!" Ikea spokesman Rodrigo Sanchez told NPR in a phone interview. "With that quantity, our servers just didn't have the capacity. They collapsed. After 48 hours, we had to temporarily close the job application process. We're working on a solution, to reopen the as soon as possible."
And since the analogies to Obamacare never end, one has no idea how many additional applicants would have tried to get a job had the servers continued to run:
... that's factoring in only the applicants in the first 48 hours, who managed to apply online before Ikea's servers crashed. Once Ikea gets its servers back up and running, the job application window will still stay open until Dec. 31, allowing potentially tens of thousands more job seekers to file applications, Sanchez said.
"I feel lucky to have a job. Ikea is a great company. In this case we have 20,000 initial people who want to work with us," he said. "But we know we're in this situation at least in part because of the state of the Spanish economy."
Why the deluge of applicants? Simple: Spain's record high unemployment rate of 26.7% is the second highest in the eurozone, matched only by Greece's 27.3%. What's worse: Spain's youth unemployment is also a record high 57.4%: nearly two out of every three people under 25 have no job. But that's ok: according to the Spanish prime minister, Spain's economy is growing and the recovery is so bright everyone's ECB rehypothecated shades will be made available shortly (together with the latest batch of Spiderman towels).
In the meantime, it is three times more difficult to get a minimum wage job at Ikea in Spain than it is to get into Harvard.
White House Says Story About White House Misleading, Is Misleading
Submitted by Tyler Durden on 11/19/2013 14:04 -0500
Anyone expecting Obama to come out with his hands up following last
night's story about the made up pre-election jobs numbers, and admit to
everything... will be disappointed.
STORY ABOUT RIGGED JOBS NUMBERS WAS MISLEADING: WHITE HOUSE
Ok everyone, back to your 29.5 hours a week job, because as everyone
knows the White House would never lie to anyone about anything.
More importantly, the Commerce Department, which was referred to
investigate the allegations of BLS fraud, thanks White House spokesman
Jay Carney for having done its investigative work for it in just a few
short hours.
Such government efficiency...
Following the White House's ignorance of anything that could be going
on at the Census Bureau (apart from knowing for sure that the report on
jobs data manipulation was misleading), the Census Bureau itself has
chimed in...
*CENSUS BUREAU SEES NO 'SYSTEMIC MANIPULATION' OF JOBS DATA
So that's good then - just unsystematic? A single-manipulator, acting alone (from the book depository?) http://www.zerohedge.com/
Friday, November 15, 2013
Will Work For Free | OFFICIAL RELEASE | 2013
Will Work For Free is a documentary by Sam Vallely on the subject of technological unemployment. this work is protected under fair use and will always be free.