Showing posts with label stock market. Show all posts

Wednesday, April 20, 2016

Stocks Are In "A Far More Precarious State Than Was Ever Truly Believed Possible"

Tyler Durden's picture

http://www.zerohedge.com/news/2016-04-19/stocks-are-far-more-precarious-state-was-ever-truly-believed-possible
Submitted by Jeffrey Snider via Alhambra Investment Partners,
As the major stock indices overtake or threaten psychological round numbers again (S&P 500 2,100; DJIA 18,000), they have done so with the same problem as occurred in 2015. Stocks have been overvalued for some time in historical comparison especially after QE3 and QE4, but it was supposed to be in anticipation of the full recovery that QE would make. For the longest time, that narrative actually seemed plausible at least in earnings. In June 2014, analysts estimated that total as-reported earnings for the calendar year of 2015 would close out around $144 per share. At an index level of 2,100, it would represent a seemingly low valuation multiple of 14.5 (low because, we were told, low discounting from historically low interest rates, favorable fixed income comparisons, and then high expected growth especially in areas like tech and consumer-related industries).
Analysts’ estimates are always overly optimistic and have the hardened habit of being lowered as each particular quarter draws closer, but what happened with 2015 was something else entirely. Instead of $144 per share, 2015 ttm EPS for the index is going to be about $86.50. Rather than leave stock investors assured in their valuations, it meant the S&P 500 was trading around 24 times actual EPS. Worse, than that, the downdraft in earnings wasn’t apparent to analysts until it actually happened (believing in “transitory” as they did) and companies reported.
ABOOK Apr 2016 EPS 2015 PE
ABOOK Apr 2016 EPS Actual 2015 ttm
As late as March 2015, analysts had been mugged by the events of late 2014 and the first parts of last year but were still predicting that earnings would grow by about 9% for the full year, including a return to “normal” growth by Q4. Even in November 2015, though the downtrend had been established in almost perfect uniformity, analysts were still expecting Q4 and then Q1 2016 to start a very strong turnaround.
From that perspective you can understand why stock investors suddenly became more than a little nervous where only certainty and confidence had existed. On the whole, it was figured that the economy would provide a solid if not historically so valuation floor for stocks that would be pushed up relentlessly by the recovery that economists and the FOMC were describing all the way into the middle of 2015 – only to find by the end of the year that the stock market may have been overvalued by as much as 40% to actual earnings (assuming a multiple of 15 represents “fair value”).
As optimism returns again, all that nasty business and “unexpected” uncertainty is being left behind as nothing more than scholarly conjecture suitable only for historians; 2016 is again on the march, or so it might seem. The surge in stocks during this “dollar” interregnum seems to be (outside of raw momentum and risk chasing) resurrecting the same assumptions as early 2015. “Transitory” has regained form only refashioned from a few months deviation to more than a year – but still to the same effect with only a delay in reaching the long-promised recovery.
ABOOK Apr 2016 EPS Projections
Reality still intrudes, however, on two fronts.
Despite analysts’ renewed faith (which sets aside all doubts that should have been their working guesses this whole time) in where earnings will fly in 2016 that still doesn’t recreate the recovery that was once the hardened baseline for projections. The current ttm EPS for 2016 is not even $110 whereas last year was supposed to be $144. It is a huge disappointment even though in relative circumstances $110 is better than $86 – and that is where the focus has returned though it should remain on the recovery’s now nearing permanent disappointment (and thus overvaluation).
The second problem is the familiar downgrade which is already severe, more so than “usual” (though less, so far, than 2015). In other words, $110 may be better than $86 but a year ago it was thought to be $124. The difference in valuation is again quite striking.
ABOOK Apr 2016 EPS 2016 PE
A forward PE using March 2015 estimates would have been somewhat expensive at about 17 times earnings but is already now more than 19 even as EPS continues to fall. Over just the last month (March to April), 2016 ttm EPS has dropped by almost $3 which again suggests that when all is completed this year a multiple of 19 will be almost certainly the best and least likely case. That would mean the assumed valuation floor is far lower for a second consecutive year, and we still have no idea just how low it may yet reach.
ABOOK Apr 2016 EPS Multiples
Where the S&P 500 may have been overvalued by perhaps 40% or more based on actual, as-reported 2015 EPS, the current annual EPS estimates suggest only a return to the 1,600 range not 2,100 or better (for the full year 2016 EPS; current estimates still plug “fair value” as something like 1,330 on the index meaning it will take a surge in earnings growth later this year just to get “fair value” back to 1,600!). As you can plainly observe above, had the 2014 version of recovery worked out the actual trajectory of the index would have been at “fair value” (though in this counterfactual it is very likely that the index and all stocks would have kept going up and up rather than sideways to lower these past nearly two years now) or close to it. Instead, the “transitory” weakness in 2015 has opened a gulf that only entrenches the high degree of overvaluation even under scenarios where 2016 isn’t so bad. That would leave stocks especially vulnerable to any further swings in sentiment as the assumed valuation “floor” quite “unexpectedly” remains quite distant.
While momentum and risk chasing take about pushing the various indices in the near term, longer term (actual) investors will be forced to reckon with this huge disparity – that prices surged after QE4 in anticipation of the recovery happening and justifying what would have been only temporary overvaluation due to the giddiness of actual discounting. The fact that earnings are now nowhere near vindicating those expectations is a fundamentally different proposition altogether, including that QE was itself a lie. I believe it is this incongruence that explains the very curious and conspicuous sideways behavior in stocks as remnants of the old QE-driven hopes remain but are no longer in such unison or enjoy such widespread support.
Doubt is the operative condition now, though especially variable in its short run expressions. It is in shorter supply today but that is no more the case than November 3 when the S&P last closed above 2,100 (just days before more “unexpected” hit) or even August 17 with the S&P 500 at 2,102 and already a week past the great Chinese warning of the intensified “dollar” run and only a week before the mini-crash of August 24 that run fulfilled.
ABOOK Apr 2016 EPS Historyb
Even if the events of 2015 and early 2016 turn out to be the end of it, it still means that full recovery in earnings and the real economy has been pushed several years farther into the future – a far more precarious state than was believed to ever be truly possible. To figure, then, that there is now much, much more than a trivial chance of still more disruption and contraction does not mix well with such durable overvaluation.

Monday, January 4, 2016

Pay Attention, Things Are Beginning To Get Interesting

Tyler Durden's picture

http://www.zerohedge.com/news/2016-01-04/pay-attention-things-are-beginning-get-interesting
Submitted by Lance Roberts via RealInvestmentAdvice.com,
There is an abundance of “Wall Street Axioms” surrounding the first month of the New Year as investors anxiously try and predict what is in store for the next twelve months. You are likely familiar with many of them from the “Superbowl Indicator” to “What Happens In The First 5-days Predicts The Month.”
Considering that trying to predict the markets more than just a few days in advance is mostly an exercise in “folly,” it is nonetheless a traditional ritual as the old year passes into the new. As Wall Street espouses their always overly optimistic projections of year-end returns, as discussed in this past weekend’s newsletter, reality has tended to be rather different.
However, from an investment management perspective, we can take a look at some of the statistical evidence for the month of January to gain some insight into performance tendencies looking ahead. From this analysis, we can potentially gain some respect for the risks that might lay ahead.
According to StockTrader’s Almanac, the direction of January’s trading (gain/loss for the month) has predicted the course of the rest of the year 75% of the time.
Furthermore, twelve or the last sixteen presidential election years followed January’s direction. Every down January on the S&P 500 since 1950, without exception, preceded a new or extended bear market, flat market or a 10% correction.
Starting from a broad historical perspective, the chart below shows the January performance going back to 1900.
January-HistoricalMonthly-Returns-010416
I have boxed in when the month of January posted consecutive negative returns. You will note that most of those consecutive negative returns coincided with bear markets such as 2002-2003 and 2008-2009. With January 2015 posting a negative return, along with the market’s weak performance, a negative return for 2016 may be a more ominous warning.
The table and chart below show the statistics by month for the S&P 500.
SP500-PerformanceByMonth-010416
January-Returns-010416
The good news is the month of January has the highest average and median return of all months of the year. It also boasts the highest number of positive return months followed by December and April.
January-Pos-Neg-Months-010416
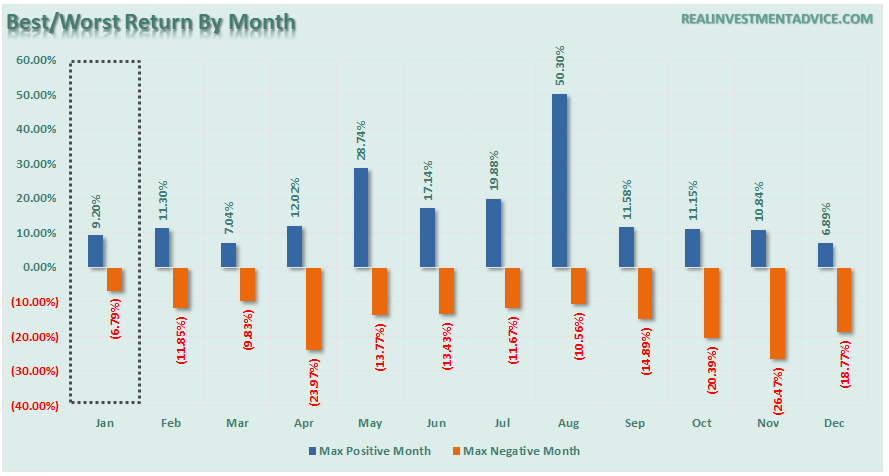
Furthermore, while January’s maximum positive return was just 9.2%, the maximum drawdown for the month was the lowest for all months at -6.79%.
January-Best-Worst-010416
While I don’t directly make asset allocation decisions based on monthly returns from a portfolio management perspective, the statistical weight of evidence suggests a couple of things worth considering.
The odds of January being a positive month greatly outweigh those of it being negative. Therefore, allocations should remain weighted more heavily towards risk currently.
However, given the length of the current bull market run from 2009 to present, the risks are mounting that January will likely have consecutive negative performance years which would confirm the ongoing market topping process I discussed previously. Such an outcome would suggest a more conservative approach to investment allocations.
This dichotomy reminds me of the scene from “The Princess Bride” where the “Sicilian” is in a “Battle Of Wits” with “The Dread Pirate Roberts.” 
While it may seem confusing, for investors it comes down to time frames.
For short-term traders, the odds are high that January will post a positive trading month, therefore, allocations should remain tilted towards equity related exposure. If you are a nimble trader and can adjust for the swings in the market, the “odds are in your favor.” 
However, for longer-term investors, particularly those that are nearing retirement, risks are mounting to the downside. Such potential outcomes suggest a more cautious approach to equity allocations in portfolios.
While the majority of the financial media and blogosphere suggest that investors should only “buy and hold” for the long-term, the reality of capital destruction during major market declines is a far more pernicious issue.
As I stated this past weekend:
“It is ALWAYS okay to miss out on an opportunity, as opportunities come along as often as a taxi-cab in New York City. However, it is IMPOSSIBLE to make up losses as you can never regain the time lost getting back to even.

It only took six years for the markets to get back to where they were prior to the financial crisis. It took just about as long to get back to even following the “Dot.com” crash in 2000.

Ladies and gentlemen – getting back to ‘even’ is NOT an investment strategy. It is a game that has been played out since the turn of the century and investors have lost out on time and inflation.

The problem for investors is 15 years to grow and compound your money for retirement is GONE. You can never regain that time. While the financial press is full of hope, optimism and advice that staying fully invested is the only way to win the long-term investing game; the reality is that most won’t live long enough to see that play out.”
With market valuations elevated, leverage high, economic weakness pervasive and profit margins deteriorating, investors should be watching the month of January carefully for clues. The weight of evidence suggests that despite ongoing “bullish calls” for the markets in the year ahead, this could be a year of disappointment.
Pay attention, things are beginning to get interesting.

Friday, January 1, 2016

2015 Was First Pre-Election Year to End In the Red Since the Great Depression

George Washington's picture

http://www.washingtonsblog.com/ 
The year before elections is almost always the best year for stocks.
Investors notes:
Pre-election years takes the top spot as the best-performing year for stocks.
UBS reports:
Ahead of US Presidential Elections  (Pre-Election Year or Year 3 and Election Year or Year 4) politicians often promote an accommodating and pro-business agenda so that the economy is  strong,  stock  market  is  bullish,  and  voters  are  upbeat  heading
to the polls.
The Stock Trader’s Almanac notes (via a press release by publisher Wiley):
Pre-election years are notoriously the best year of the four-year cycle and fifth years of decades are the strongest, so 2015 has some solid history behind it,” says the Almanac’sEditor-in-chief Jeffrey A. Hirsch. “The Dow has not had a loss in a pre-election year since 1939.
But in 2015, the Dow closed down for the year … 2.2% into the red.

Tuesday, October 13, 2015

4 Warnings And Why You Should Pay Attention

Tyler Durden's picture

http://www.zerohedge.com/news/2015-10-13/4-warnings-and-why-you-should-pay-attention
Submitted by Lance Roberts via STA Wealth Management,

Tuesday, July 7, 2015

China's stock market is crashing, and the Chinese are trying to do the exact same thing America did in 1929

JP Morgan
(AP Images) Four members of the House of Morgan stand on a balcony outside the Senate Banking Committee room just before the committee resumed its investigation into the banking institution's practices, May 31, 1933, in Washington.
While attention is focused on Greece, China is having a serious market meltdown.
After exploding earlier in the year because of deregulation, China's benchmark Shanghai Composite has collapsed a crazy 29% since the highs of early June. China's other stock markets have had similarly steep falls.
Bloomberg notes that the crisis is closely mirroring the 1929 Wall Street crash, which led to the Great Depression in the US in the 1930s.
China's government is now also using the same tactics as Wall Street did back then to try to prop up the markets.
Over the weekend China's top stock brokerages pledged that they would collectively buy at least 120 billion yuan (£12.3 billion, $19.3 billion) of shares to help steady the market, with backing from the People's Bank of China.
The central bank is effectively becoming the buyer of last resort, printing money to buy up shares and prop up prices.
In 1929, Wall Street's banks did something similar. JPMorgan and several other top financial firms agreed to pool resources and buy up shares to put a floor under prices. It happened after a drop of about 30% for the Dow Jones Industrial Average.
The effort by the US banking systems had only the briefest of effects on the index, and America was eventually plunged into the Great Depression.
It's too early to tell whether China's latest move will work, despite the insistence of state media. So far it has failed to curb the huge volatility that has been plaguing China's stock markets recently. The Shanghai Composite opened up over 7% and eventually slipped back into the red before ending the day up 2.4%.

Friday, June 26, 2015

"Blood On The Streets": Chinese 'Nasdaq' Crashes Most On Record, Morgan Stanley Warns "Don't Buy This Dip"

Tyler Durden's picture

http://www.zerohedge.com/news/2015-06-25/chinese-equity-futures-tumble-ahead-open-morgan-stanely-warns-dont-buy-dip-0
You were warned...


China's "Nasdaq" - the 90% small-cap tech-firm dominated CHINEXT is down 8.3% intraday - its biggest single-day loss ever... it is now down 27% from its highs!


At the end of the morning session, there is blood on the streets of Shanghai and Shenzhen...


Remember, it's a no-brainer... As one middle-aged rural Chinese chap exclaimed jubilantly, "it's easier to make money from stocks than farmwork."
Maybe it's time to go back to farmwork after all...

*  *  *
So - do investors really want this kind of volatility in the MSCI indices? If China is allowed to correct now, it will wipe out trllions of wealth from the average Chinese person... at a time when regulators are urging professional asset managers NOT to speculate in stocks.
*  *  *
And this is what we noted earlier...
Is it time to step in and buy the dip in Chinese mainland shares after last week’s harrowing 13% decline on the SHCOMP? Absolutely not, Morgan Stanley says.
Beijing is fighting desperately to keep the country’s stock market miracle alive, as China needs a distraction to deflect attention from the flagging economy and bursting real estate bubble. But aggressive policy rate cuts and an abrupt 180 on LGVF financing for local government projects are working at cross purposes with efforts to deleverage the economy (which is laboring under a $28 trillion debt load) which include allowing for more defaults, reining in shadow financing, and restructuring a local government debt pile that amounts to 35% of GDP.
In addition to contradictory policy decisions, Beijing is also struggling to reconcile slumping exports with accelerating capital outflows, a combination which makes currency devaluation both necessary and impossible at the same time.
In this context, it’s easy to see why a stock market collapse would be a particularly unwelcome event and until last week, the music was still playing thanks to anticipation surrounding A share inclusion in FTSE and MSCI EM benchmark indices. Now, with China’s millions of newly-minted day traders having recently discovered that stocks can go down as well as up, and with a contraction of margin financing via umbrella trusts beginning to weigh, there are renewed questions about the sustainability of the rally. Here’s Morgan Stanley with more:
Our stance on China A shares is that this is probably not a dip to buy. In fact, we think the balance of probabilities is that the top for the cycle on Shanghai, Shenzhen and Chinext has now taken place. We remain concerned over four factors: a) increased equity supply, b) continued weak earnings growth in the context of economic deceleration, c) high valuations, and d) very high margin debt to free float market capitalization. Our Shanghai Composite Index EPS forecasts for 2015 and 2016 are significantly lower than consensus (5% vs. 9% for 2015, and 8% vs. 16% for 2016). 

We set a new 12-month Target Price range for Shanghai Composite of 3,250-4,600. This range is -30% to -2% below the current level of the index (4,690 as of June 24 close). Our base case EPS integer forecast for Shanghai for June 2016 is 259 versus consensus' 279 (7% lower). 


We forecast 5% base case EPS growth in 2015 and 8% in 2016 for the Shanghai-A index, which is significantly lower than the current I/B/E/S consensus numbers of 9% for 2015 and 16% for 2016. Recent earnings growth trends continue to be poor. Trailing EPS y-o-y growth rate for the Shanghai Composite Index in June has dropped to -1.3% from 7.3% a year ago. For the Shenzhen Composite Index, yoy growth has dropped to 6.8% from 11.5% a year ago. This poor momentum in EPS in a forecast continued weak economy is the primary reason why we have modeled for below-consensus EPS growth.

In summary, we project that China's economy will continue to struggle over the next 12 months as it transitions towards consumption- and services-led growth in the face of the legacy of the rapid build-up in leverage in recent years and significant excess capacity in the 'old economy' sectors. As a result, our base case June 2016 12-month EPS forecast is 259, 7% lower than the consensus number of 279. 


We have often heard in recent months that the Chinese authorities would not allow a market decline as we are now forecasting. The implied move from the peak on June 12 – if that is the peak – to the lower end of our new Target Price range for mid-2016 would represent a decline of 37%. Certainly, it is true that the Chinese authorities have been more vocal in their support for the development of the market in this cycle than in previous cycles, where major declines occurred within one year after the peak. However, our general view is that governments are not able to exert direct control over stock market behaviour, in particular where trading volumes, valuations and margin leverage are as stretched, as they are now in China. For us, ultimately this argument against a sustained bear phase for China A shares over the next 12 months sounds almost as dubious as what we were hearing in late 2007. Then, it was frequently argued that the Chinese authorities would not let the A share equity markets decline before the major international prestige event of the Beijing Olympics in August 2008. The Shanghai Composite fell by 57% from the peak in October 2007 to the opening days of the Beijing Olympics.
And sure enough, based on CSI-300 futures, China is not seeing any bounce whatsoever after yesterday continued crash...


With cash marketsdown sharply now they are open...


  • *SHANGHAI COMPOSITE SLUMPS 3.5% AT OPEN
With CHINEXT in a bear market - they are trying something else:
  • *HIGH-TECH COS. ACCOUNT FOR ABOUT 90% OF CHINEXT FIRMS: XIAO
  • *CHINA TO START EQUITY CROWDFUNDING TRIAL: XIAO GANG
and the rest of Chinese stocks in correction at best, one wonders if the PBOC will stand idly by as the bubble they unleashed crashes and burns bringing down most of rural China's wealth with it...

Monday, April 6, 2015

If Anyone Doubts We Are In A Stock Market Bubble, Show Them This

Tyler Durden's picture

http://www.zerohedge.com/news/2015-04-05/if-anyone-doubts-we-are-stock-market-bubble-show-them
Submitted by Michael Snyder via The Economic Collapse blog,
The higher financial markets rise, the harder they fall.  By any objective measurement, the stock market is currently well into bubble territory.  Anyone should be able to see this – all you have to do is look at the charts.  Sadly, most of us never seem to learn from history.  Most of us want to believe that somehow “things are different this time”.  Well, about the only thing that is different this time is that our economy is in far worse shape than it was just prior to the last major financial crisis.  That means that we are more vulnerable and will almost certainly endure even more damage this time around.
It would be one thing if stocks were soaring because the U.S. economy as a whole was doing extremely well.  But we all know that isn’t true.  Instead, what we have been experiencing is clearly artificial market behavior that has nothing to do with economic reality.  In other words, we are dealing with an irrational financial bubble, and all irrational financial bubbles eventually burst.  And as I wrote about yesterday, the way that stocks have moved so far this year is eerily reminiscent of the way that stocks moved in early 2008.  The warning signs are there – if you are willing to look at them.
The first chart that I want to share with you today comes from Doug Short.  It is a chart that shows that the ratio of corporate equities (stocks) to GDP is the second highest that it has been since 1950.  The only other time it has been higher was just before the dotcom bubble burst…
The Buffett Indicator from Doug Short
Does that look like a bubble to you?
It sure looks like a bubble to me.
In order for the corporate equities to GDP ratio to get back to the mean (average) level, stock prices would have to fall nearly 50 percent.
If that happens, people will be calling it a crash, but in truth it would just be a return to normalcy.
This next chart comes from Phoenix Capital Research.  The CAPE ratio (cyclically adjusted price-to-earnings ratio) is considered to be an extremely accurate measure of the true value of stocks…
As I’ve noted before, the single best predictor of stock market performance is the cyclically adjusted price-to-earnings ratio or CAPE ratio.

Corporate earnings are heavily influenced by the business cycle. Typically the US experiences a boom and bust once every ten years or so. As such, companies will naturally have higher P/E’s at some points and lower P/E’s at other. This is based solely on the business cycle and nothing else.

CAPE adjusts for this by measuring the price of stocks against the average of ten years’ worth of earnings, adjusted for inflation. By doing this, it presents you with a clearer, more objective picture of a company’s ability to produce cash in any economic environment.
Based on a study completed Vanguard, CAPE was the single best metric for measuring future stock returns.
When the CAPE ratio is too high, that means that stocks are overpriced and are not a good value.  And right now the CAPE ratio is the 3rd highest that it has been since 1890.  That only times it has been higher than this were in 1929 (we all remember what happened then) and just before the dotcom bubble burst…
CAPE - Phoenix Capital Research
The funny thing is that stocks have continued to rise even as corporate revenues have begun to fall.
According to Wolf Richter, in the first quarter of 2015 corporate revenues are projected to decline at the fastest pace that we have seen since the depths of the last recession…
Week after week, corporations and analysts have been whittling down their estimates. By now, revenues of the S&P 500 companies are expected to decline 2.8% in Q1 from a year ago – the worst year-over-year decline since Q3 of crisis year 2009.
This next chart I want to share with you shows how the Nasdaq has performed over the past decade.  Looking at this chart alone, you would think that the U.S. economy must have been absolutely roaring since the end of the last recession.  But what is really going on is rampant speculation.  Some of the tech companies that make up the Nasdaq are not making any profits at all and yet they are supposedly worth billions of dollars.  If you cannot see a bubble in this chart, you need to get your vision checked…
NASDAQ Chart
And this kind of irrational euphoria is not just happening in the United States.
For example, Chinese stocks are up nearly 80 percent over the past nine months.
Meanwhile, the overall Chinese economy is growing at the slowest pace that we have seen in about 20 years.
Right now, we are in the calm before the storm.  We are right at the door of the next great financial crisis, and most of the people that work in the industry know this.
And once in a while they let the cat out of the bag.
For example, consider what Hans-Jörg Vetter, the CEO of Landesbank Baden-Württemberg in Germany, had to say during one recent press conference…
“Risk is no longer priced in,” he said. And these investors aren’t paid for the risks they’re taking. This applies to all asset classes, he said. The stock and the bond markets, he said, are now both seeing “the mother of all bubbles.”

This can’t go on forever. Or for very long. But he couldn’t see the future either and pin down a date, which is what everyone wants to know so that they can all get out in time. “I cannot tell you when it will rumble,” he said, “but eventually it will rumble again.”

By “again” he meant the sort of thing that had taken the bank down last time, the Financial Crisis. It had been triggered by horrendous risk-taking, where risks hadn’t been priced into all kinds of securities. When those securities – mortgage-backed securities, for example, that were hiding the inherent risks under a triple-A rating – blew up, banks toppled.
What Vetter is telling us is what I have been warning about for a long time.
Another great stock market crash is coming.
It is just a matter of time.

Thursday, December 18, 2014

Fed Cat Bounce: Stocks Soar Most In 3 Years As Crude Crash Continues

Just 1 word... "Patient" and this idiotic market soars 700 Dow points! (and S&P 90 Up ) - Quad Witching Machines in full retard mode... This is the biggest 2-day swing since Dec 2011.


Up 4-5% in 48 hours...


"Most Shorted" stocks are up 4.75% from yesterday's lows - the biggest squeeze since October 2011.


Since The FOMC...


Dismal Data... Buy Stocks


HY Credit dumping... Buy Stocks


VIX protection bid... Buy Stocks


Crude Carnage... Buy Stocks


JPY Carry unwinds... Buy Stocks


Inflation expectations collapsing... Buy Stocks


You're getting the picture.
The USDollar rallied...


Treasury yields rose quite notably...


And commodities generally flatlined as oil roundtripped...


Finally, Russia "stabilized" overnight following Putin's annual Q&A...


Charts: Bloomberg
http://www.zerohedge.com/news/2014-12-18/fed-cat-bounce-stocks-soar-most-3-years-crude-crash-continues