Showing posts with label unemployment. Show all posts

Tuesday, April 26, 2016

In 1 Out Of Every 5 American Families, Nobody Has A Job

Tyler Durden's picture

http://www.zerohedge.com/news/2016-04-25/1-out-every-5-american-families-nobody-has-job
Submitted by Michael Snyder via The Economic Collapse blog,
If nobody is working in one out of every five U.S. families, then how in the world can the unemployment rate be close to 5 percent as the Obama administration keeps insisting? The truth, of course, is that the U.S. economy is in far worse condition than we are being told. Last week, I discussed the fact that the Federal Reserve has found that 47 percent of all Americans would not be able to come up with $400 for an unexpected visit to the emergency room without borrowing it or selling something. But Barack Obama and his minions never bring up that number. Nor do they ever bring up the fact that 20 percent of all families in America are completely unemployed. The following comes directly from the Bureau of Labor Statistics
In 2015, the share of families with an employed member was 80.3 percent, up by 0.2 percentage point from 2014. The likelihood of having an employed family member rose in 2015 for Black families (from 76.4 percent to 77.7 percent) and for Hispanic families (from 85.9 percent to 86.4 percent). The likelihood for White and Asian families showed little or no change (80.1 percent and 88.6 percent, respectively).
For purposes of this study, families “are classified either as married-couple families or as families maintained by women or men without spouses present” and they include households without children as well as children under the age of 18.
Digging into the numbers, we find that there were a total of 81,410,000 families in America during the 2015 calendar year.
Of that total, 16,060,000 families did not have a single member employed.
So that means that in 19.7 percent of all families in the United States, nobody has a job.
And of course there are lots more families that are “partially employed”. In other words, maybe the wife has a job but the husband does not.
So based on these numbers, it would appear to me that the true rate of unemployment in this country is vastly higher than 5 percent, and John Williams of shadowstats.com agrees with me. According to his calculations, the broadest measure of unemployment in the U.S. would actually be sitting at 22.9 percent if honest numbers were being used.
But let’s not just focus on where we are.
Let’s take a look at where we are going.
According to Challenger, Gray & Christmas, job cut announcements by big companies in the United States were up 32 percent during the first quarter of 2016 compared to the first quarter of 2015, and it appears that the job losses are going to continue to mount as we roll into the second quarter. For instance, late last week Intel announced that it is going to be laying off 12,000 workers
As it navigates its path into the future, Intel, the 47-year-old corporation best known for making microprocessor chips that power personal computers, has announced significant changes to its business.

On Tuesday, Intel’s CEO Brian Krzanich said in a letter to employees that the company over the next year will cut its 107,300-person global workforce by 12,000 people, or 11 percent.
Those are good middle class jobs, and they are exactly the kind of jobs that we cannot afford to be losing.
Meanwhile, the “retail apocalypse” appears to be accelerating once again.
Bloomberg is reporting that teen clothing chain Aeropostale is preparing to file for bankruptcy.  Aeropostale currently operates more than 800 stores across the nation, and it is unclear if any of them will be able to stay open as this process plays out. But of course it isn’t just Aeropostale that has gone bankrupt lately. Here are a few more examples of major retailers that have recently filed for bankruptcy
April 16, 2016: Vestis Retail Group, the operator of sporting goods retailers Eastern Mountain Sports (camping, hiking, skiing, adventure sports), Bob’s Stores (family clothing and shoes), and Sport Chalet (general sporting goods), filed for Chapter 11 bankruptcy. It will close all 56 stores and stop online sales.

In the filing, it blamed the going-out-of-business sales at “certain Sports Authority locations,” plus the weather, which had been too warm, and trouble with switching to a new software platform. It’s owned by private equity firm Versa Capital Management LLC.

April 7, 2016: Pacific Sunwear of California, clothing retailer with nearly 600 stores and derailed ambitions of skate-and-surf cool, filed for Chapter 11 bankruptcy. PE firm Golden Gate Capital, a lender to the company, agreed to convert over 65% of its loan into equity of the reorganized company and add another $20 million in financing. Wells Fargo agreed to provide $100 million of debtor-in-possession financing.

March 2, 2016: Sports Authority filed for Chapter 11 bankruptcy. It said it would close 140 of its 450 stores, including all stores in Texas.
Just because the stock market has been doing well in recent weeks does not mean that the crisis has passed.
In fact, many experts believe that the crisis of 2016 is just getting started.  Albert Edwards of Societe Generale is one of them
But what I do know is when in the last few weeks I have heard that Janet Yellen sees no bubble in the US, when Ben Bernanke hones and restates his helicopter money speech, and when Mario Draghi says that the ECB’s policy of printing money and negative interest rates was working, I feel utterly depressed (I could also quote similar nonsense from Japan, the UK and China). I have not one scintilla of doubt that these central bankers will destroy the enfeebled world economy with their clumsy interventions and that political chaos will be the ugly result.

The only people who will benefit are not investors, but anarchists who will embrace with delight the resulting chaos these policies will bring!
All over the world, the underlying economic fundamentals continue to deteriorate. Here in the U.S., retail sales have been extremely disappointing, total business sales have been steadily falling, corporate revenues and corporate profits continue to plunge, and corporate debt defaults have soared to their highest level since the last financial crisis.
All of these numbers are screaming that a major economic downturn is here, and with each passing week things look even more ominous for the second half of 2016.

Monday, March 28, 2016

23% Of Americans In Their Prime Working Years Are Unemployed

Tyler Durden's picture

http://www.zerohedge.com/news/2016-03-28/23-americans-their-prime-working-years-are-unemployed
Submitted by Michael Snyder via The Economic Collapse blog,
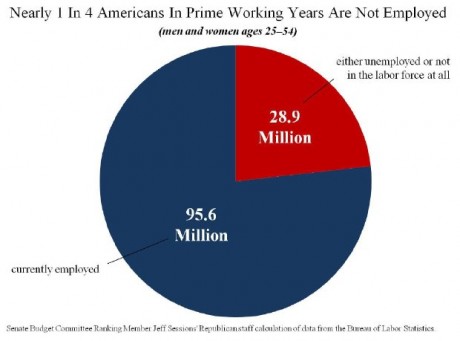
Did you know that when you take the number of working age Americans that are officially unemployed (8.2 million) and add that number to the number of working age Americans that are considered to be “not in the labor force” (94.3 million), that gives us a grand total of 102.5 million working age Americans that do not have a job right now?  I have written about this before, but today I want to focus just on Americans that are in their prime working years.  When you look at only Americans that are from age 25 to age 54, 23.2 percent of them are unemployed right now.  The following analysis and chart come from the Weekly Standard
Here’s a chart showing those in that age group currently employed (95.6 million) and those who aren’t (28.9 million):

Americans In Their Prime Working Years Not Working

“There are 124.5 million Americans in their prime working years (ages 25–54). Nearly one-quarter of this group—28.9 million people, or 23.2 percent of the total—is not currently employed. They either became so discouraged that they left the labor force entirely, or they are in the labor force but unemployed.

This group of non-employed individuals is more than 3.5 million larger than before the recession began in 2007,” writes the Republican side of the Senate Budget Committee.
Clearly, we have never recovered from the impact of the last recession.
But let’s try to put these numbers in context.
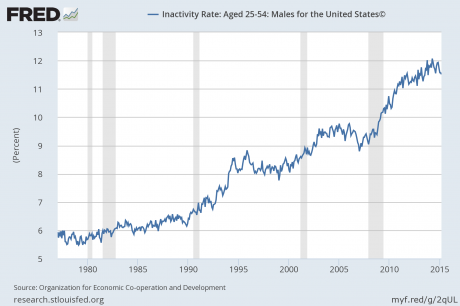
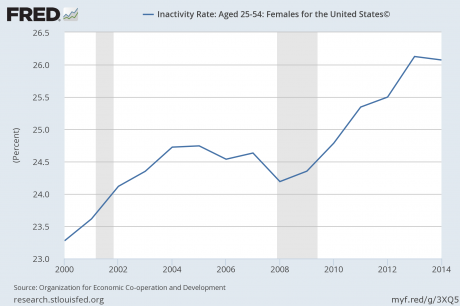
Below, I would like to share two charts with you.  They show what has happened to the inactivity rates for men and for women in their prime working years in the United States in recent years.
In order to be considered “inactive”, you can’t have a job and you can’t be looking for a job.  So this subset of people is smaller than the group that we were talking about above.  The 23.2 percent of Americans in their prime working years that are unemployed right now includes those that are looking for a job and those that are not looking for a job.
These next two charts do not include anyone that has a job or that is currently looking for a job.  These charts only cover “inactive” people in their prime working years that are not considered to be in the labor force.
As you can see in this first chart, the inactivity rate for men in their prime working years exploded higher during the last recession and then continued to go up even after the recession supposedly ended.  At this point, it is hovering near all-time record highs.  Does this look like an “economic recovery” to you?…
Inactivity Rate Men
For women, we see a similar thing.  In this next chart, you can see that the inactivity rate for women in their prime working years rose during the last recession and then just kept on rising.  At this point, it is also hovering near all-time record highs…
Inactivity Rate Women
What are we to make of all this?
For both men and women in their prime working years, the inactivity rate is even higher than it was during the last recession and is hovering near the all-time record.
All of these people neither have a job nor are they looking for one.
So what in the world is going on here?
Are they independently wealthy?
Have these people found rich spouses to marry so they don’t have to work?
No, the truth is that the middle class in America is steadily eroding and poverty is absolutely exploding.  Credit card debt has soared to a new record high, and 48 percent of all U.S. adults under the age of 30 believe that “the American Dream is dead”.
The issue isn’t that people don’t want to work.
The issue is that people cannot find enough work.
And even if you have a job, that does not mean that you are on easy street.  According to the Social Security Administration, 51 percent of all American workers make less than $30,000 a year.
Tens of millions of Americans are now among the ranks of “the working poor”.  So many families are watching their expenses soar while their paychecks go down or stagnate.  If you are in this situation right now, then you probably know how exceedingly stressful it can be.
Just look at what is happening to the cost of health insurance.  The following comes from Fox News
Health insurance premiums have increased faster than wages and inflation in recent years, rising an average of 28 percent from 2009 to 2014 despite the enactment of Obamacare, according to a report from Freedom Partners.
And I am not exactly sure where they got those numbers.  Personally, I know that my health insurance rates have gone up far faster than that.
Two years ago, my health insurance company wanted to double the health insurance premiums for my family even though we never get sick.  So I switched to another insurance company that offered a policy that was only about 30 percent higher than my last one.  But then when it came time to renew, that insurance company wanted to raise my rate by another 50 percent.
Thanks to Obamacare, American families are being absolutely crippled by the cost of health care.  And of course we are seeing the rising cost of living so many other places as well.  Our paychecks are being squeezed harder and harder, and this is absolutely killing the middle class.  In fact, the middle class in America is now a minority for the first time ever.
And now for the real bad news – this is about as good as things are ever going to get in this country.  As you can see from what I have shared above, we never really had any sort of meaningful “economic recovery”, and now we have entered the early phases of the next major downturn.
So where do we go from here?  Unfortunately, our debt-fueled prosperity has provided us with a massively inflated standard of living that is not even close to sustainable.  As this bubble bursts, the economic pain is going to be absolutely unprecedented.

Saturday, January 9, 2016

Newsflash From The December 'Jobs' Report - The US Economy Is Dead In The Water

Tyler Durden's picture


http://www.zerohedge.com/news/2016-01-09/newsflash-december-jobs-report-us-economy-dead-water
Here’s a newsflash that CNBC didn’t mention. According to the BLS, the US economy generated aminiscule 11,000 jobs in the month of December.
Yet notwithstanding the fact that almost nobody works outside any more, the BLS fiction writers added 281,000 to their headline number to cover the “seasonal adjustment.” This is done on the apparent truism that December is generally colder than November and that workers get holiday vacations.
Of course, this December was much warmer, not colder, than average.  And that’s not the only deviation from normal seasonal trends.
The Christmas selling season this year, for example, was absolutely not comparable to the ghosts of Christmas past. Bricks and mortar retail is in turmoil and in secular decline due to Amazon and its e-commerce ilk, and this trend is accelerating by the year.
So too, energy and export based sectors have been thrown for a loop in the last few months by a surging dollar and collapsing commodity prices. Likewise, construction activity has been so weak in this cycle—-and for the good reason that both commercial and residential stock is vastly overbuilt owing to two decades of cheap credit—–that its not remotely comparable to historic patterns.
Never mind. The BLS always adds the same big dollop of jobs to the December establishment survey come hell or high water. In fact, the seasonal adjustment has averaged 320,000 for the last 12 years!
For crying out loud, folks, every December is different—–and not just because of the vagaries of the weather. Capitalism is about incessant change and reallocation of economic activity and resources. And now the globalized ebbs and flows of economic activity have only accentuated the rate and intensity of these adjustments.
Yet the statistical wizards at the BLS think they can approximate a seasonal adjustment factor for December that at +/- 300k amounts to just 0.2% of the currently reported 144.2 million establishment survey jobs, and an even smaller fraction of the potential adult work force which is at least 165 million.
But that’s a pretentious stab in the dark. The December seasonal adjustment (SA) could just as easily be 0.3% of the job base or 0.1%, depending upon the specific point in the business cycle and structural trends roiling the economy.
Indeed, these brackets alone would vary the headline SA number by 150k to 450k. The fact that the seasonal adjustment factor for December has oscillated tightly around 300,000 for the last 12 years proves only one thing—–namely, that the bureaucrats at the BLS have chosen to invent the same guesstimate year after year; its not science, its political fiction.
The fact is, the seasonal adjustment factors are about the closest thing there is to pure noise among all the dubious “incoming” data that the Fed and Wall Street obsess over.
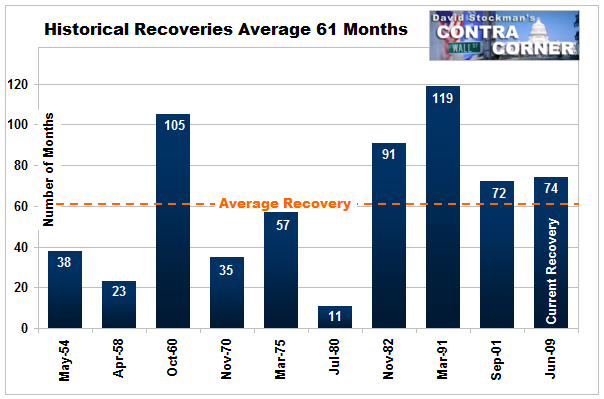
Here’s a better take on the matter. We are now in the 78th month since the June 2009 recession bottom, and are reaching the point where this so-called business cycle expansion is getting very long in the tooth by all historical standards.
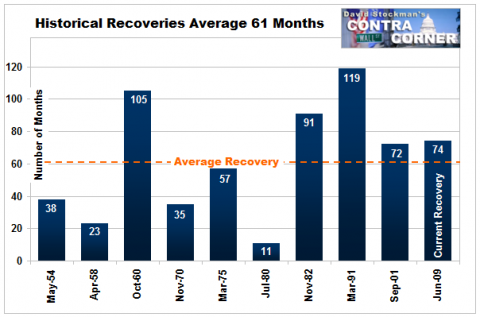
Historical Length of Recoveries - Click to enlarge
Historical Length of Recoveries
So what happened to the non-seasonally adjusted (NSA) job count in December at similar points late in the course of prior cycles? Well, in December 1999 about 140,000 jobs were added and in December 2007 there was a NSA gain of 212,000. This time we got the magnificent sum of 11,000, and by the way, last year was only 6,000.
The real news flash in the December “jobs” report, therefore, is that even by the lights of the BLS’ rickety, archaic and virtually worthless establishment survey, the domestic economy is dead in the water. We are not on the verge of “escape velocity”, as our foolish monetary politburo keeps insisting; the US economy is actually knocking on the door of recession.
And that’s why the retail sheep have been led to the slaughter once again in the Wall Street casino. The cats who run it have embraced the nonfarm payroll report as the primo macroeconomic indicator because they know that it drastically lags the real drivers of main street activity and has an abysmal record of forecasting turns in the macroeconomic cycle.
Stated differently, these fictional monthly SA jobs numbers are extremely useful to the Wall Street sell side. They keep the rubes hitting the “buy” button until the fast money can slowly dump its holdings and get out of Dodge; or even pivot and reload to the short side.
That’s right. We are not talking tin foil hats here. It is plain as day that the BLS’ seasonal adjustments are a completely stupid waste of time. During the winter season especially, it might as well just use a random numbers generator.
Indeed, here’s what the Steve Liesman’s of the world never tell you—–undoubtedly because they don’t know. Fully two-thirds or 200,000 of the 300,000 December seasonal adjustment is in the construction sector!
So the whole December SA is essentially a weather proxy designed to adjust a survey taken during the middle week of the first month of winter. Could weather fluctuations impact the number of construction workers on the job by a mere 2% (150,000) around the week of December 15?
Well, yes it could. And that means we really don’t know whether 292,000 “jobs” were created in December or whether it was only 142,000.
Once again, loose the SA noise in the construction sector job count.  This category alone accounted for 45,000 of the headline gain, but that was owing to the fact that the 6.538 million figure reported for the construction category was flattered by a 196,000 seasonal adjustment.
Instead, look at the non-seasonally adjusted (NSA) number compared to the same point in the cycle from prior history. Thus, at the December 2006 peak the number of construction jobs was 7.585 million, meaning we are still down by 1.1 million jobs or 15% from the prior cycle high.
And in December 2000, there were actually 6.7 million construction jobs. That is, we have not yet returned to the cyclically comparable level that prevailed at the turn of the century.
In short, the December jobs report was not evidence of a “strong” economy. It was just another emission from the government’s SA noise factory that obscures the actual state of the main street economy.
So here’s the real truth. Construction jobs are breadwinner jobs. The average annualized pay rate for the category is $57,000, but the US economy is not actually generating new construction jobs any longer.
What’s happening is that the BLS is simply reporting “born again” jobs and thereby enabling the Keynesian chorus to claim “progress” and “strength”, and for its Wall Street section to blather about “blow-out numbers”. Indeed, the latter has embraced the Keynesian model lock, stock and barrel precisely because its so useful in the stock peddling business.
The Keynesian model is about deltas, not levels. For reasons we will amplify below that’s almost always misleading in the context of monetary central planning and the bubble finance cycles that flow from it.
In fact, the only valid measure of economic strength and the main stream economy’s capacity to support sustainable profit growth and higher stock prices is the change in levels over time at cyclically comparable points.
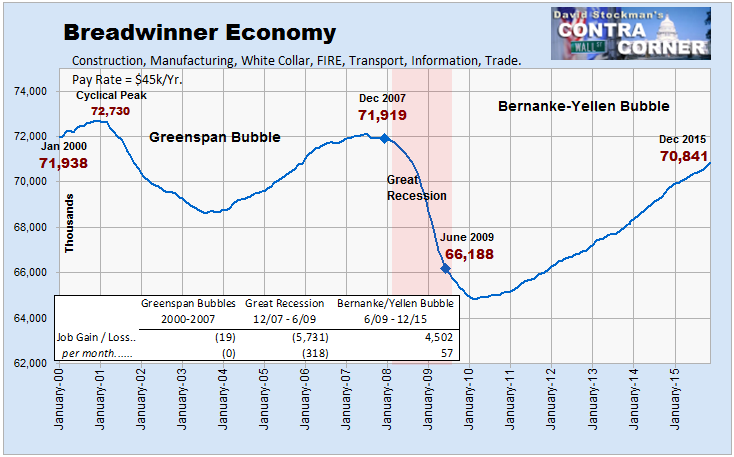
That gets us to the larger story embedded in the above observations about the construction sector jobs series. Namely, just as there have been no trend gains in the level of construction jobs since the turn of the century, the same is true of the much wider swath of what we have called “breadwinner jobs”.
These jobs in construction, energy and minerals, manufacturing, FIRE, the white collar professions, business management, information technology and trade/distribution account for 50% of all nonfarm payroll slots, pay upwards of $50,000 per year on average and account for more than 66% of total wage and salary disbursements.
Yet the December 2015 number of breadwinner jobs was still 1.1 million jobs below that posted for the first month of this century!
Breadwinner Economy Jobs - Click to enlarge
Needless to say, that’s not “strength”. It’s actually a profound indictment of the archaic convention embedded in the monthly employment report that counts job slots, not the variable gigs and hours on which employment in the contemporary US economy is actually based.
Indeed, all the Jobs Friday hoopla is based on your grandfather’s BLS survey, which arose at a time when everyone punched the clock at the Ford factory 40-50 hours per week, including overtime. By contrast, now the greeters and cash register operators at Wal-Mart are computer-scheduled in 15 minute increments.
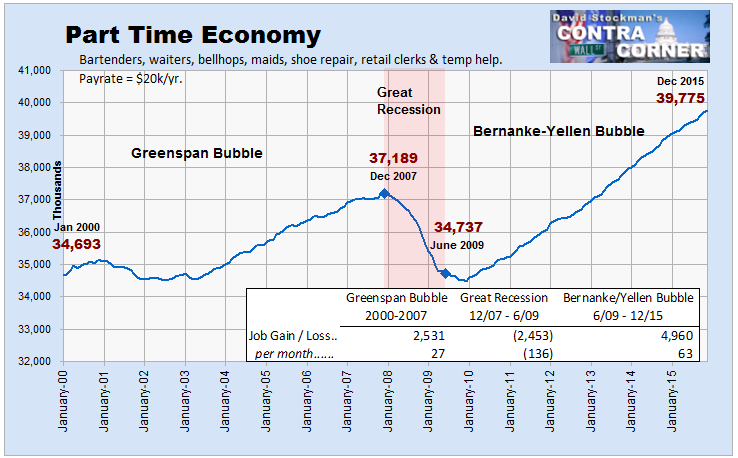
Since average pay for the bartenders and waiters category is less than $20,000 on an annualized basis owing to an average of 26 hours per week and $13/hour pay rates, you need 2.5 of these gigs to get the equivalent of one breadwinner job. Yet on Jobs Friday its all one job, one vote.
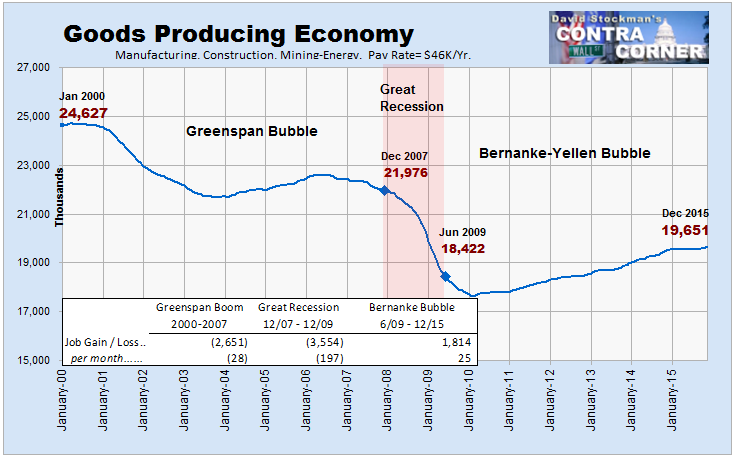
So what is actually happening beneath the surface is a great swap out. The very highest productivity jobs in goods production are disappearing on a trend basis; the monthly deltas reported so breathlessly on bubble vision actually embody purely “born again” employment slots that represent the partial recovery of jobs lost during each crash of the Fed’s serial financial bubbles.
But the cyclically adjusted trend is down, not up. It represents economic weakness and reduced capacity to generate productivity, income and profits, not strength.
In fact, not withstanding the “blow-out” December numbers, the US economy still has 11% fewer jobs in goods production—-mining, energy, manufacturing and construction—–than it did at the December 2007 cyclical peak, and 21% fewer than at the turn of the century.
Goods Producing Economy -Click to enlarge
By contrast, what is being swapped in are what we have called Part-Time Economy jobs, where there have been modest cyclically comparable gains in job levels during the past 15 years. Needless to say, however, the average annualized pay rate in this category is less than $20,000.
Part Time Economy Jobs - Click to enlarge
But even these trend level gains are heavily concentrated in the lowest quality quadrant. That is, in what we have called the “Bread and Circuses Economy”—–bartenders, waiters, bellhops, maids, parking attendants, hot dog vendors and the like.
The fact is, this category accounts for full 70%, or 1.8 million, of the 2.59 million gain in Part Time Economy jobs since the pre-recession peak in December 2007.
Bread and Circuses Economy - Click to enlarge
Another factor obscured by the BLS’ archaic job slot counting convention is the root wealth and productivity contribution of the job count at any point in time. Generally, private sector jobs financed by consumers add to wealth and productivity at varying degrees, depending on the sector.
By contrast, taxpayer financed jobs—–directly through government outlays or indirectly through heavy tax subsidies and preferences—–do not add to wealth, and, not to put too fine a point on it, may well subtract from it. And that gets us to the HES Complex (health, education and social services).
This is the fastest growing job category since the turn of the century, yet it now depends upon more than $2 trillion per year of Medicare, Medicaid and other government health spending—–plus another $250 billion or so of tax expenditures for employer health plans and tax credits for education.
HES Complex - Click to enlarge
Yes, it can be argued that a some part of the current 32.6 million jobs in the HES Complex add to long-run productivity via education and health status improvement of the working age population. But that point does not get you too far if you recognize the abject and worsening failure of public education in the US and the gross inefficiency of our third-party payment dominated health care system.
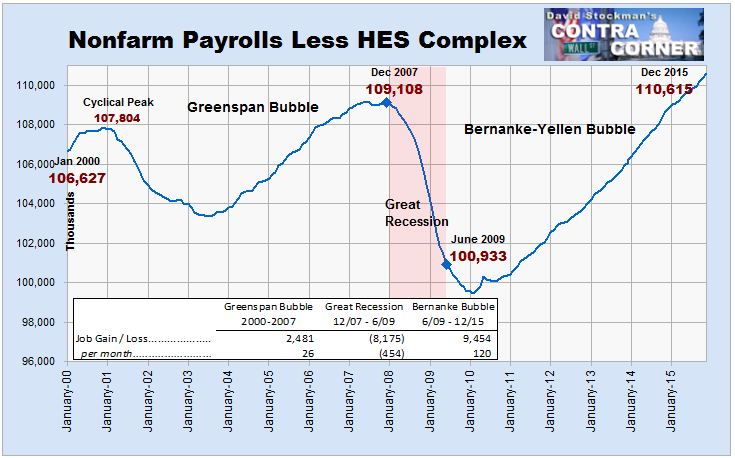
Far more relevant is this fact. For the entirety of this century there has been only a 3.7%  net gain in even the gross number of job slots in the US economy outside of the HES Complex, and that measurement includes the Part Time Economy and its Bread and Circuses subset.
Stated differently, on a trend level basis, the US economy has only generated 21,000 jobs per month over the last 15 years that were not funded by the public fisc, and therefore indirectly by the $10 trillion gain in public sector debts since the turn of the century.
Nonfarm Payrolls Less HES Complex - - Click to enlarge
So whatever is embedded in the BLS payroll count, don’t call it recovery, strength or progress. Instead, call it a propaganda cloud that serves the interests of Wall Street and the monetary central planners, alike.
Here’s the thing. You can not sell stock if you tell customers that a recession is coming and earnings are going to be heading sharply in a southerly direction. So Wall Street never does.
By the spring of 2008, for example, after the subprime mortgage implosion was already well underway, Countrywide Financial had already failed, AIG was hitting the rocks, Bear Stearns was gone, and housing sales and starts were sliding rapidly from their towering peaks, the Wall Street consensus ex-items hockey stick still pointed to S&P earnings of $115 per share.
As it happened, the actual result was $15 per share. And the homegamers who stayed in the market on that assurance were treated, instead, to a bloodbath in which they lost trillions in the 401k and brokerage accounts.
Likewise, the monetary central planners at the Fed and their economist cheerleaders have never forecast a recession. That’s because they embrace the cardinal Keynesian Error, which holds that private capitalism is inherently unstable and prone to extreme cyclical swings—-even a tendency toward depressionary black holes.
So they assume that their policy tools and maneuvers are not only doing gods work of keeping private capitalism on the straight and narrow. Indeed, the arrogant and foolish professor from Princeton, Ben Bernanke, called it The Great Moderation in March 2004 just as the greatest bubble and bust in modern history was working up a head of steam.
Notwithstanding the thumping repudiation of that conceit which occurred during the great financial crisis and recession, the predicate remains that this time is different. To wit, the monetary central planners now have it right and will steer the US economy deftly to the nirvana of permanent Full Employment, world without end.

Thursday, October 8, 2015

Why This Feels Like A Depression For Most People

Tyler Durden's picture


http://www.zerohedge.com/news/2015-10-08/why-feels-depression-most-people 
“And the little screaming fact that sounds through all history: repression works only to strengthen and knit the repressed.”  John Steinbeck, The Grapes of Wrath

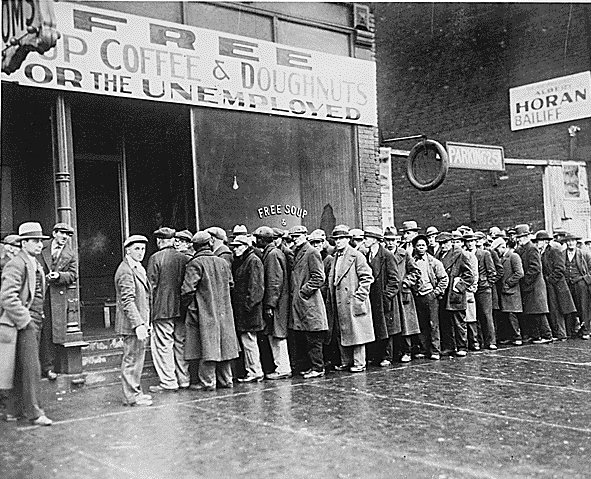
Everyone has seen the pictures of the unemployed waiting in soup lines during the Great Depression.When you try to tell a propaganda believing, willfully ignorant, mainstream media watching, math challenged consumer we are in the midst of a Greater Depression, they act as if you’ve lost your mind. They will immediately bluster about the 5.1% unemployment rate, record corporate profits, and stock market near all-time highs. The cognitive dissonance of these people is only exceeded by their inability to understand basic mathematical concepts.
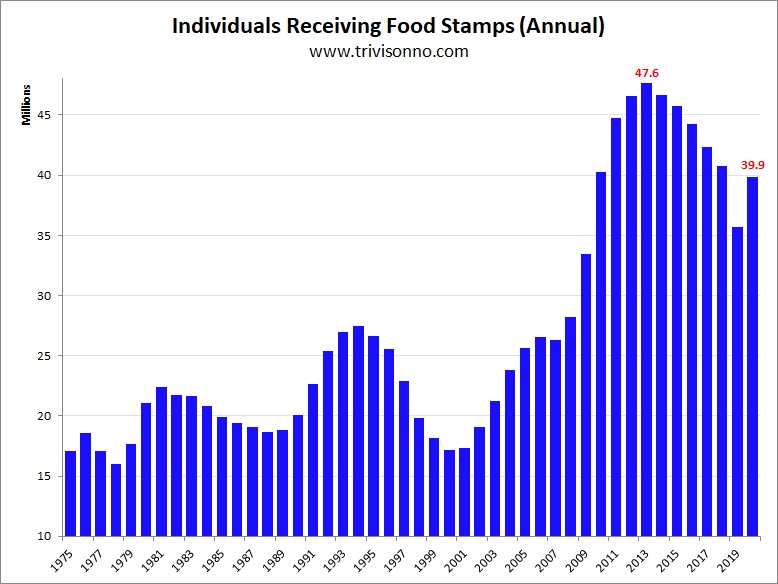
The reason you don’t see huge lines of people waiting in soup lines during this Greater Depression is because the government has figured out how to disguise suffering through modern technology. During the height of the Great Depression in 1933, there were 12.8 million Americans unemployed. These were the men pictured in the soup lines. Today, there are 46 million Americans in an electronic soup kitchen line, as their food is distributed through EBT cards (with that angel of mercy JP Morgan reaping billions in profits by processing the transactions).
These 46 million people represent 14% of the U.S. population. There are 23 million households on food stamps in a nation of 123 million households. Therefore, 19% of all households in the U.S. are so poor, they require food assistance to survive. In 1933 there were approximately 126 million Americans living in 30 million households. The government didn’t keep official unemployment records until 1940, but the Department of Labor estimated 12.8 million people were unemployed during the worst year of the Great Depression or 24.9% of the labor force. By 1937 it had fallen to 14.3% or approximately 8 million people.
The number of people unemployed during the 1930’s is an excellent representation of the number of households on government assistance during the Great Depression because 79% of all households were occupied by married couples with 4 people per household versus 48% married couple households today with 2.5 people per household. The unemployment rate averaged 19% during the heart of the Great Depression. Therefore, approximately 19% of all the households in the U.S. needed government assistance to feed themselves. That happens to be the exact percentage of households currently needing food stamps to feed themselves.
We are now supposedly five years into an economic recovery. The unemployment rate, according to the government, has fallen from 10% to 5.1%. Maybe a comparison to the the Great Depression in 1937, five years after the worst of it, would reveal some truth. It is not easy to do an apples to apples comparison because very few women worked outside the home in 1937 and the average life expectancy in the 1930s was 60 years old. Today, the majority of women are theoretically in the work force and the average life expectancy is 78 years old. In 1937 only 5% of the population was over 65 years old versus 13% today.
There were approximately 55 million Americans in the labor force in 1937, according to the DOL, and approximately 47 million of them were employed. So 85% of the eligible work force was working. There was no BLS to massage, manipulate, seasonally adjust, or fake the data to make things appear better than they were in 1937. Edward Bernay’s Propaganda techniques and methodologies weren’t perfected for a few more years. According to Census information there were 52 million Americans between the ages of 18 and 44, along with another 21 million between the ages of 45 and 64 in 1937. So even considering that very few women worked and many people died by the age of 60, we had a workforce of 55 million out of an age eligible population of 73 million at a maximum. That yields a participation rate of 75%.
These facts reveal the utter falsity of the propaganda drenched duplicitous data dumped by the BLS on behalf of vested interests who have captured our government and have an agenda requiring the public to be kept in the dark regarding their own dire financial situation. No matter how you slice the data, it reveals an absolute parallel to the situation during the Great Depression. There are 251 million Americans of working age and only 149 million are employed, of which 20 million are part-time and 8 million are self employed. Only 59% of working age Americans actually work. The BLS has the cajones to declare that only 157 million of the 251 million working age Americans are actually in the labor force.
This outrageous assumption flies in the face of all reasonableness, facts, and truth. In 1937, even with women not working outside the home and very few people living past 65 years old, the participation rate was 75%. Today, with the majority of women capable and willing to work and older Americans working well into their 60s, the BLS actually expects a critical thinking person to believe the participation rate is only 62.4%, the lowest since 1977. It’s a pure and simple despicable lie. The true participation rate should exceed the rate in 1937, based on the facts. Using the 75% participation rate today, yields a true unemployment rate of 21%, not the preposterous 5.1% shoveled by the bullshit artists at the BLS. The 21% rate ties very closely to the figure arrived at by John Williams at Shadowstats. An unbiased assessment of the facts reveals unemployment numbers and people on government assistance numbers that match or exceed those of the Great Depression.
I also wonder whether the corporate mainstream media purposely chooses not to show pictures of the poor waiting in long lines to be fed because their function is not to report facts and truth, but to perpetuate the lie that all is well in America.  I pass the Grace Lutheran church at 36th and Haverford Avenue in West Philly everyday on my way to work. Every Thursday is when the church, in partnership with the Philabundance food bank, distributes free food to the people of West Philly. The line stretches around the block at 7:30 am awaiting the Philabundance truck to arrive. There are old, young, black, white, Latino, and Asian in the line. It looks exactly like the line pictured in the Great Depression above. I’m sure there are similar scenes across every city in America on a daily basis. People dependent on food banks and living in homeless shelters are at record levels. Where are the mainstream media pictures? How does that jive with Ben Bernanke’s self congratulatory book tour about how he saved America by secretly handing Wall Street and foreign bankers $16 trillion?
For the average American family, the US economy has been in recession since 2000, with the Greater Depression arriving in 2008. The working age population has grown by 40 million since 2000, with only 12 million jobs added over that time frame. Of those, 10 million were in the government controlled health, education, social services (HES) sectors, with millions of good paying manufacturing jobs destroyed, replaced by a couple million low paying services jobs. As David Stockman points out, Bernanke and the vested interests he serves continue to spew disingenuous propaganda  to cover up the fact average American households continue to experience depression-like conditions. When your real household income is lower than it was in 1989, while your basic living costs for food, energy, transportation, rent, housing, healthcare, taxes, and education have skyrocketed, you just might be experiencing a depression.
“The Fed’s balance sheet has grown from $500 billion to $4.5 trillion or 9X during that span, but job growth outside the HES Complex amounts to less than 2%. For crying out loud, that’s a 12,000 per month rounding error in an economy which has 250 million adults. Virtually every job gained since December 2009 shown in the chart below was not a “new” job at all; it was just a “born-again” job that Greenspan had claimed credit for a few years earlier. Yet Bernanke has the nerve to boast about the Fed’s success on jobs and claim that the “labor market is close to normal”!”
Edward Bernays wrote the book Propaganda in 1928. It was utilized quite well by Goebbels and Hitler over the next decade or so. But the corporate fascist oligarchy, disguised as American democracy, puts Goebbels efforts to shame. Bernays would be thrilled by the efficiency and professionalism with which the invisible Deep State governing power is able to utilize mass media, the internet, public schools, and academia to shape, mold, manipulate and alter the minds of the masses.The unholy alliance between shadowy billionaires, a private bank owned by Wall Street and controlling our currency, the military industrial complex, the sick care complex, mega-corporations peddling consumer goods, and politicians who are easily bought, has left a hollowed out rotting carcass of a nation, with the peasants experiencing a depression, while the lords of the manor feast like there is no tomorrow. But at least the 103 million peasants who aren’t working believe only 5.1% of them are unemployed. It’s a Bernaysian Miracle!!!
“The conscious and intelligent manipulation of the organized habits and opinions of the masses is an important element in democratic society. Those who manipulate this unseen mechanism of society constitute an invisible government which is the true ruling power of our country. …We are governed, our minds are molded, our tastes formed, our ideas suggested, largely by men we have never heard of. This is a logical result of the way in which our democratic society is organized. Vast numbers of human beings must cooperate in this manner if they are to live together as a smoothly functioning society. …In almost every act of our daily lives, whether in the sphere of politics or business, in our social conduct or our ethical thinking, we are dominated by the relatively small number of persons…who understand the mental processes and social patterns of the masses. It is they who pull the wires which control the public mind.”– Edward Bernays – Propaganda

Thursday, September 10, 2015

698K Native-Born Americans Lost Their Job In August: Why This Suddenly Is The Most Important Jobs Chart

Tyler Durden's picture

http://www.zerohedge.com/news/2015-09-07/698k-native-born-americans-lost-their-job-august-why-suddenly-most-important-jobs-ch
After the Fed admitted over a year ago that the US unemployment rate (which in 2012 was supposed to be a rate hike "threshold" once it hit 6.5% and is now at 5.1%) has become irrelevant in a country where a record 94 million people have left the labor force, and with the Fed poised to hike rates even though US hourly wages have not only not increased for the past 7 years, but for the vast majority of the labor force continue to decline, some have asked - is there any labor-related chart that matters any more?
The answer: a resounding yes, only it is none of the conventional charts that algos and sometimes humans look at.
The one chart that matters more than ever,has little to nothing to do with the Fed's monetary policy, but everything to do with the November 2016 presidential elections in which the topic of immigration, both legal and illegal, is shaping up to be the most rancorous, contentious and divisive.
The chart is the following, showing the cumulative addition of foreign-born and native-born workers added to US payrolls according to the BLS since December 2007, i.e., since the start of the recession/Second Great Depression.


The chart is especially important because what it shows for just the month of August will be enough to provide the Trump - and every other - campaign with enough soundbites and pivot points to last it for weeks on end: namely, that in August a whopping 698,000 native-born Americans lost their job. This drop was offset by 204,000 foreign-born Americans, who got a job in the month of August.


But the punchline: since December 2007, according to the Household Survey, only 790,000 native born American jobs have been added. Contrast that with the 2.1 million foreign-born Americans who have found a job over the same time period...

... and you have a combustible mess that will lead to serious fireworks during the next GOP primary.

Saturday, January 25, 2014

20 Early Warning Signs That We Are Approaching A Global Economic Meltdown

Tyler Durden's picture


Submitted by Michael Snyder of The Economic Collapse blog,
Have you been paying attention to what has been happening in Argentina, Venezuela, Brazil, Ukraine, Turkey and China?  If you are like most Americans, you have not been.  Most Americans don't seem to really care too much about what is happening in the rest of the world, but they should.  In major cities all over the globe right now, there is looting, violence, shortages of basic supplies, and runs on the banks.  We are not at a "global crisis" stage yet, but things are getting worse with each passing day.  For a while, I have felt that 2014 would turn out to be a major "turning point" for the global economy, and so far that is exactly what it is turning out to be.  The following are 20 early warning signs that we are rapidly approaching a global economic meltdown...
#1 The looting, violence and economic chaos that is happening in Argentina right now is a perfect example of what can happen when you print too much money...
For Dominga Kanaza, it wasn’t just the soaring inflation or the weeklong blackouts or even the looting that frayed her nerves.

It was all of them combined.

At one point last month, the 37-year-old shop owner refused to open the metal shutters protecting her corner grocery in downtown Buenos Aires more than a few inches -- just enough to sell soda to passersby on a sweltering summer day.
#2 The value of the Argentine Peso is absolutely collapsing.
#3 Widespread shortages, looting and accelerating inflation are also causing huge problems in Venezuela...
Economic mismanagement in Venezuela has reached such a level that it risks inciting a violent popular reaction. Venezuela is experiencing declining export revenues, accelerating inflation and widespread shortages of basic consumer goods. At the same time, the Maduro administration has foreclosed peaceful options for Venezuelans to bring about a change in its current policies.

President Maduro, who came to power in a highly-contested election last April, has reacted to the economic crisis with interventionist and increasingly authoritarian measures. His recent orders to slash prices of goods sold in private businesses resulted in episodes of looting, which suggests a latent potential for violence. He has put the armed forces on the street to enforce his economic decrees, exposing them to popular discontent.
#4 In a stunning decision, the Venezuelan government has just announced that it has devalued the Bolivar by more than 40 percent.
#5 Brazilian stocks declined sharply on Thursday.  There is a tremendous amount of concern that the economic meltdown that is happening in Argentina is going to spill over into Brazil.
#6 Ukraine is rapidly coming apart at the seams...
A tense ceasefire was announced in Kiev on the fifth day of violence, with radical protesters and riot police holding their position. Opposition leaders are negotiating with the government, but doubts remain that they will be able to stop the rioters.
#7 It appears that a bank run has begun in China...
As China's CNR reports, depositors in some of Yancheng City's largest farmers' co-operative mutual fund societies ("banks") have been unable to withdraw "hundreds of millions" in deposits in the last few weeks. "Everyone wants to borrow and no one wants to save," warned one 'salesperson', "and loan repayments are difficult to recover." There is "no money" and the doors are locked.
#8 Art Cashin of UBS is warning that credit markets in China "may be broken".  For much more on this, please see my recent article entitled "The $23 Trillion Credit Bubble In China Is Starting To Collapse – Global Financial Crisis Next?"
#9 News that China's manufacturing sector is contracting shook up financial markets on Thursday...
Wall Street was rattled by a key reading on China's manufacturing which dropped below the key 50 level in January, according to HSBC. A reading below 50 on the HSBC flash manufacturing PMI suggests economic contraction.
#10 Japanese stocks experienced their biggest drop in 7 months on Thursday.
#11 The value of the Turkish Lira is absolutely collapsing.
#12 The unemployment rate in France has risen for 9 quarters in a row and recently soared to a new 16 year high.
#13 In Italy, the unemployment rate has soared to a brand new all-time record high of 12.7 percent.
#14 The unemployment rate in Spain is sitting at an all-time record high of 26.7 percent.
#15 This year, the Baltic Dry Index experienced the largest two week post-holiday decline that we have ever seen.
#16 Chipmaker Intel recently announced that it plans to eliminate 5,000 jobs over the coming year.
#17 CNBC is reporting that U.S. retailers just experienced "the worst holiday season since 2008".
#18 A recent CNBC article stated that U.S. consumers should expect a "tsunami" of store closings in the retail industry...
Get ready for the next era in retail—one that will be characterized by far fewer shops and smaller stores.

On Tuesday, Sears said that it will shutter its flagship store in downtown Chicago in April. It's the latest of about 300 store closures in the U.S. that Sears has made since 2010. The news follows announcements earlier this month of multiple store closings from major department stores J.C. Penney and Macy's.

Further signs of cuts in the industry came Wednesday, when Target said that it will eliminate 475 jobs worldwide, including some at its Minnesota headquarters, and not fill 700 empty positions.
#19 The U.S. Congress is facing another deadline to raise the debt ceiling in February.
#20 The Dow fell by more than 170 points on Thursday.  It is becoming increasingly likely that "the peak of the market" is now in the rear view mirror.
And I have not even mentioned the extreme drought that has caused the U.S. cattle herd to drop to a 61 year low or the nuclear radiation from Fukushima that is washing up on the west coast.
In light of everything above, is there anyone out there that still wants to claim that "everything is going to be okay" for the global economy?
Sadly, most Americans are not even aware of most of these things.
All over the country today, the number one news headline is about Justin Bieber.  The mainstream media is absolutely obsessed with celebrity scandals, and so is a very large percentage of the U.S. population.
A great economic storm is rapidly approaching, and most people don't even seem to notice the storm clouds that are gathering on the horizon.
In the end, perhaps we will get what we deserve as a nation.
http://www.zerohedge.com/news/2014-01-24/20-early-warning-signs-we-are-approaching-global-economic-meltdown

Saturday, January 11, 2014

What Caused the Crash In the Labor Participation Rate?

Workers May Simply Be Giving Up

Zero Hedge notes that the number of Americans in the labor force has dropped to 1978 levels:
The civilian labor force … dropped from 155.3 million to 154.9 million, which means the labor participation rate just dropped to a fresh 35 year low, hitting levels not seen since 1978, at 62.8% down from 63.0%.
And the piece de resistance: Americans not in the labor force exploded higher by 535,000 to a new all time high 91.8 million.
What’s causing the crash in labor participation?
Initially, the number of women not in the labor force climbed to a new high.  This is significant because the labor force skyrocketed in the 1960s when feminism encouraged women to work outside of the home:
As the Washington post notes in a fantastic roundup on unemployment:
The Urban Institute notes [that] what’s happening is that workers aren’t entering the labor force at the same rates they used to. That’s especially true for women, who are much less likely to enter the labor force today than they were in 2002 and 2003. Many of them, the paper notes, appear to be enrolling in school instead or deciding to start families.
An aging U.S. demographic may also play some role in the decline.  As the Washington Post notes:
Americans over the age of 65 are much less likely to work than prime-age Americans. And since that subset of Americans is expanding its ranks, that drives the labor-force participation rate down.
***
Economists disagree, however, on exactly how much demographics are responsible for the current fall in the participation rate. The Chicago Fed estimated in 2012 that retirements accounted for one-fourth of the drop in labor force participation since the recession began. Other analysts, including Barclays, have suggested that aging Boomers could account for a bigger slice of the drop.
Meanwhile, a recent paper by Shigeru Fujita of the Federal Reserve Bank of Philadelphia staked out a more nuanced view: Demographics, he argued, didn’t play a huge role in the labor-force drop between 2007 and 2011. But since then, retirements are responsible for basically the entire fall of the participation rate. One possible reason is that many older Americans postponed retirement immediately after the financial crisis to rebuild their battered 401(k)s. By 2012 or so, they began retiring en masse.
However, Zero Hedge and Bloomberg show that there are countervailing trends:
Most disturbingly, the Post notes that the main factor may be workers simply giving up:
The number of Americans working or actively seeking work has actually fallen faster than demographers had predicted:
epop graph-thumb-615x395-82792
And here’s another clue that this isn’t just a demographic story: The participation rate for workers between ages 25 and 54 fell sharply during the recession and still hasn’t recovered. Obviously, retirements can’t explain this:
Credit: Calculated RiskCredit: Calculated Risk
So, what’s going on? One theory is that the weak job market is causing people to simply give up looking for work — they’re crumpling up their résumés and going home. An recent study from the Boston Fed suggested that these “non-inevitable dropouts” might even account for most of the decrease. Among other things, the authors noted that the labor-force decline has been far sharper for all age groups than simple demographics would predict.
***
So, why does the size of the labor force matter? If people are leaving the labor force for economic reasons (and they’re not going back to school), it would mean that the economy is in much worse shape than the official unemployment rate suggests. The jobless rate is officially 6.7 percent, but that only counts people who are actively seeking work — not labor-force dropouts. [Remember, you have to include labor-force dropouts in order to arrive at a useful unemployment number.]
The size of the labor force also goes a long way to determining America’s growth prospects. If, say, baby boomers are retiring faster than expected, then long-run U.S. economic growth will be lower than projected.
***
It could also mean the U.S. economy will be significantly weaker in future. One recent paper from the Federal Reserve estimated that America’s economic potential is now 7 percent lower than it was before the financial crisis — in part because workers who lost their jobs during the downturn have become less-attached to the labor force. That’s a bad sign.
In other words, the crash in labor force participation rate is a very significant indication that all is not well with the economy.
Unfortunately – instead of helping to reduce unemployment – bad government policy has made it much worse. And see here and here.