Showing posts with label consumerism. Show all posts

Wednesday, April 20, 2016

What Everyone Is Missing In The Oil Supply/Demand Conundrum

Tyler Durden's picture

http://www.zerohedge.com/news/2016-04-19/what-everyone-missing-oil-supplydemand-conundrum
Submitted by Gail Tverberg via Our Finite World blog,
Oil production can be confusing because there are various “pieces” that may or may not be included. In this analysis, I look at oil production of the United States broadly (including crude oil, natural gas plant liquids, and biofuels), because this is the way oil consumption is defined. I also provide some thoughts regarding the direction of future world oil prices.
Figure 1. US Liquid Fuels production by month based on EIA March 2016 Monthly Energy Review Reports.
US oil production clearly flattened out in 2015. If we look at changes relative to the same month, one-year prior, we see that as of December 2014, growth was very high, increasing by 18.0% relative to the prior year.
Figure 2. US Liquids Growth Over 12 Months Prior based on EIA's March 2016 Monthly Energy Review.
Figure 2. US Liquids Growth Over 12 Months Prior based on EIA’s March 2016 Monthly Energy Review.
By December 2015, growth over the prior year finally turned slightly negative, with production for the month down 0.2% relative to one year prior. It should be noted that in the above charts, amounts are on an “energy produced” or “British Thermal Units” (Btu) basis. Using this approach, ethanol and natural gas liquids get less credit than they would using a barrels-per-day approach. This reflects the fact that these products are less energy-dense.
Figure 3 shows the trend in month-by-month production.
Figure 3. US total liquids production since January 2013, based on EIA's March 2016 Monthly Energy Review.
Figure 3. US total liquids production since January 2013, based on EIA’s March 2016 Monthly Energy Review.
The high month for production was April 2015, and production has been down since then. The production of natural gas liquids and biofuels has tended to continue to rise, partially offsetting the fall in crude oil production. Production amounts for recent months include estimates, and actual amounts may differ from these estimates. As a result, updated EIA data may eventually show a somewhat different pattern.
Taking a longer view of US liquids production, this is what we see for the three categories separately:
Figure 4. US Liquid Fuel Production since 1949, based on EIA's March 2016 Monthly Energy Review.
Figure 4. US Liquid Fuel Production since 1949, based on EIA’s March 2016 Monthly Energy Review.
Growth in US liquid fuel production slowed in 2015. The increase in liquid fuels production in 2015 amounted to 1.96 quadrillion Btus (“quads”), or about 59% as much as the increase in production in 2014 of 3.34 quads. On a barrels-per-day (bpd) basis, this would equate to roughly a 1.0 million bpd increase in 2015, compared to a 1.68 million bpd increase in 2014.
The data in Figure 4 indicates that with all categories included, 2015 liquids exceeded the 1970 peak by 16%. Considering crude oil alone, 2015 production amounted to 98% of the 1970 peak.
Figure 5 shows an approximate breakdown of crude oil production since 1945 on a bpd basis. The big spike in production is from tight oil, which is another name for oil from shale.
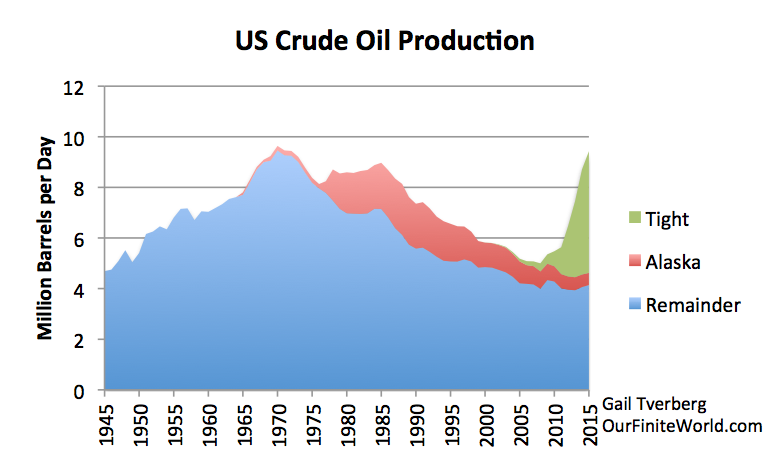
Figure 5. Oil crude oil production separated into tight oil (from shale), oil from Alaska, and all other, based on EIA oil production data by state.
Here again, US crude oil production in 2015 appears to amount to 98% of the 1970 crude oil peak. Thus, on a crude oil basis alone, we have not yet hit the 1970 peak.

Prospects for an Oil Price Rise

Most recent analyses of oil prices have focused on the amount of mismatch between supply and demand, and the need to craft a temporary agreement to reduce oil production. The thing that is missing in this discussion is an analysis of buying power of consumers. Is the problem a temporary problem, or a permanent one?
In order for oil product demand to keep rising, the buying power of consumers needs to keep rising. In other words, some combination of consumer wages and debt levels of consumers needs to keep rising. (Rising debt is helpful because, with more debt, it is often possible to buy goods that would not otherwise be affordable.)
We know that in many countries, wages for lower-level workers have stagnated for a number of reasons, including competition with wages in lower-wage countries, computerization, and the use of automation (Figure 6). Thus, we know that low wages for a large share of consumers may be a problem.
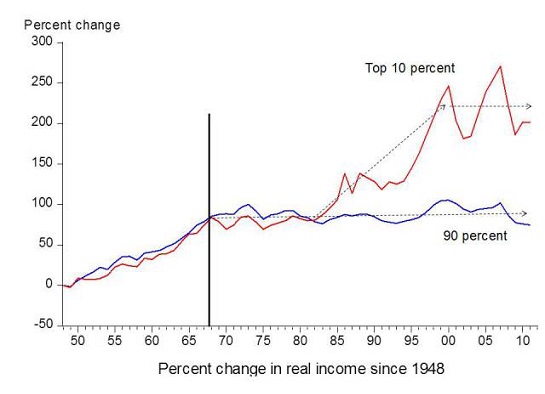
Figure 6. Chart comparing income gains by the top 10% to income gains by the bottom 90% by economist Emmanuel Saez. Based on an analysis IRS data, published in Forbes.
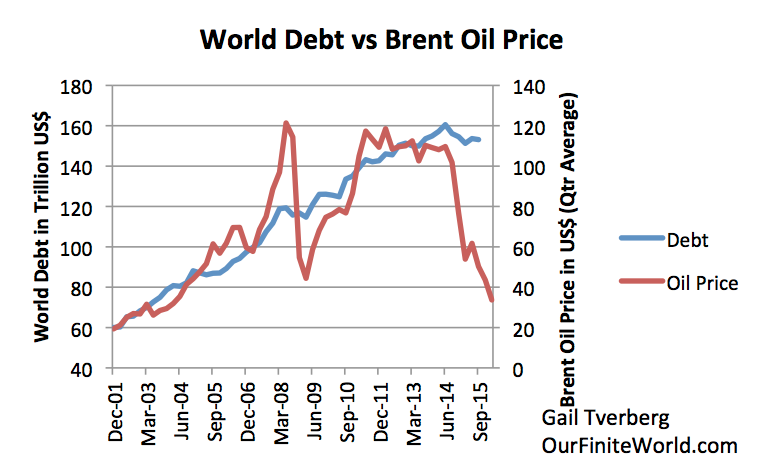
Figure 6. Chart comparing US income gains by the top 10% to income gains by the bottom 90% by economist Emmanuel Saez. Based on an analysis IRS data, published in Forbes.
Figure 7 shows that world debt has been falling since June 30, 2014. This is precisely the time when world oil prices started falling.
Figure 6. Total non-financial world debt based on Bank for International Settlements data and average Brent oil price for the quarter, based on EIA data.
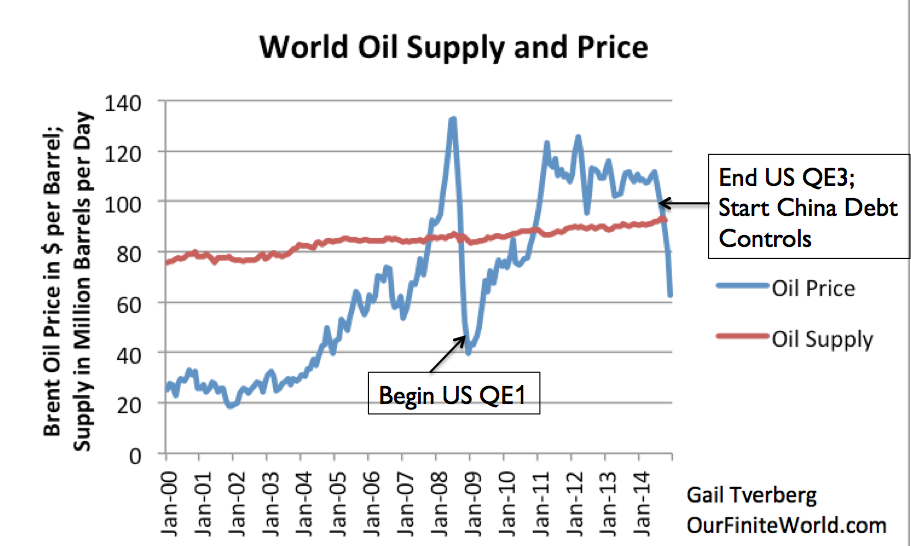
Figure 7. Total non-financial world debt based on Bank for International Settlements data and average Brent oil price for the quarter, based on EIA data.
One reason for the fall in world debt, measured in US dollars, is the fact that the US dollar started rising relative to other currencies about this time. Oil is priced in dollars; if the US dollar rises relative to other currencies, it makes oil less affordable to those whose currencies have lower values. The big rise in the level of the dollar came when the US discontinued quantitative easing in 2014. World debt, as measured in US dollars, began to fall as the US dollar rose.
Figure 7. World Oil Supply (production including biofuels, natural gas liquids) and Brent monthly average spot prices, based on EIA data.
Figure 8. World Oil Supply (production including biofuels, natural gas liquids) and Brent monthly average spot prices, based on EIA data.
As long as the US dollar is high relative to other currencies, oil products remain less affordable, and demand tends to stay low.
Another issue that struck me in looking at world debt data is the way the growth in debt is distributed (Figure 9). Debt growth for households has been much lower than for businesses and governments.
Figure 8. World non-financial debt divided among debt of households, businesses, and governments, based on Bank for International Settlements data.
Figure 9. World non-financial debt divided among debt of households, businesses, and governments, based on Bank for International Settlements data.
Since March 31, 2008, non-financial debt of households has been close to flat. In fact, between June 30, 2014 and September 30, 2015,  it shrank by 6.3%. In contrast, non-financial debt of both businesses and governments has risen since March 31, 2008. Government debt has shrunk by 5.6% since June 30, 2014–almost as large a percentage drop as for household debt.
The issue that we need to be aware of is that consumers are the foundation of the economy. If their wages are not rising rapidly, and if their buying power (considering both debt and wages) is not rising by very much, they are not going to be buying very many new houses and cars–the big products that require oil consumption. Businesses may think that they can continue to grow without taking the consumer along, but very soon this growth proves to be a myth. Governments cannot grow without rising wages either, because the majority of their tax revenue comes from individuals, rather than corporations.
Today, there is a great deal of faith that oil prices will rise, if someone, somewhere, will reduce oil production. In fact, in order to bring oil demand back up to a level that commands a price over $100 per barrel, we need consumers who can afford to buy a growing quantity of goods made with oil products. To do this, we need to fix three related problems:
  • Low wages of many consumers
  • World debt that is no longer rising (especially for consumers)
  • A high dollar relative to other currencies
These problems are likely to be difficult to fix, so we should expect low oil prices, more or less indefinitely. Lack of oil supply may bring a temporary spike in oil prices, but it cannot fix a permanent problem with consumer spending around the world.

Monday, October 26, 2015

Everyone Is Asking: "If Chinese Consumption Is Rising, Why Are Its Malls Empty?" - Here Is The Answer

Tyler Durden's picture

http://www.zerohedge.com/news/2015-10-26/if-chinese-consumption-rising-why-are-its-malls-empty-many-ask-here-answer
With China's official headline GDP number printing at decade lows, the positive spin on the increasingly negative data out of China has been that this is all a part of China's transition from an export-oriented to a consumption economy. However, there is a problem with this narrative: malls and shopping centers in China have been, and remain, increasingly empty suggesting that the narrative of the  resurgent Chinese consumer - especially in the aftermath of the biggest stock market bubble burst since 2008 - is greatly exaggerated.
Case in point: Reuters asks this morning "why are malls closing if consumption is rising?"

Specifically, it looks at the Di Mei shopping center in downtown Shanghai which it finds "a surprisingly depressing place to shop."
The underground mall is located in one of the most shopping-mad cities in China, and yet it is run down and starved of customers."

"Sometimes I cannot sell even one dress in a day," said dress shop owner Ms Xu, who rents a space in Di Mei.

Rising vacancy rates and plummeting rents are increasingly common in Chinese malls and department stores, despite official data showing a sharp rebound in retail sales that helped the world's second-largest economy beat expectations in the third quarter.
It sure makes one wonder just how credible China's retail sales "data" are, especially since the government is far less willing to provide official commercial vacancy rates: "As growth in retail sales slows because of the country's lower GDP growth, and in cities where mall space is abundant, vacancy rates have risen substantially," said Moody's analyst Marie Lam in a research note.
One possible answer to this seeming conundrum is a well-known one: the transition to online shopping which however does not explain all the recent bearish commentary from China's premier online vendor Ali Baba, which recently tumbled below its IPO price after announcing the slowest revenue growth in three years.
There is another twist: the government is goosing retail sales by acting as a direct end-purchaser:
The answer to that apparent contradiction lies in the rising competition from online shopping and government purchases possibly boosting retail statistics. Add poorly managed properties into the equation and the empty malls aren't much of a surprise.

More importantly, the struggles of Chinese brick-and-mortar retailers amplify a policy conundrum; these malls, built to reap gains from rising consumption, are instead adding to China’s corporate debt problem, currently at 160 percent of GDP - twice as high as the United States.

Less foot traffic means cash flow of mall owners and developers are getting squeezed - a potential hazard for an economy growing at its slowest pace in decades.

Di Mei's owners are trying to refurbish, but it's unclear whether it will pay off, and others are just closing down. The Sunlight Store in Beijing, for example, is located in another prime pedestrian hub, but it closed its blinds this month, with manager Ni Guifang telling Reuters they are seeking greener pastures online.

"The sales were just OK, but the overall sales were on the downward trend," Ni said.

* * *
On the other hand, e-commerce sites continue to post double-digit growth rates, even as some moderation is evident. E-commerce leader Alibaba (BABA.N) is expected to report that sales growth slowed sharply in the second quarter - albeit to around 27 percent on-year, still a ripping pace.
There is another, potentially benign explanation: overcapacity - after all China's "ghost shopping malls" have been well-known for years.
China is currently the site of more than half the world's shopping mall construction, according to CBRE, a real estate firm, even though it appears that many of these malls will not produce good returns for their investors.  A joint report by the China Chain Store Association and Deloitte showed that by the end of this year, the total number of China's new malls is projected to reach 4,000, a jump of over 40 percent from 2011.
This brings up two follow up problems: one is that this overcapacity will remain in place for years, leading to much less construction and expansion in the coming years: "Real estate analysts note that much of the surge in retail space construction came at the behest of local governments, who were rushing to push real estate development as part of attempts to stimulate the economy. The result has been malls built in haste and managed poorly."
An even bigger problem is that sooner or later, all these bad debt that was used to fund this construction scramble and which currently generates no cash flow, will have to be reclassified as non-performing sooner or later: "If you build it and they're not coming, that's a non-performing loan," said Tim Condon of ING.
As a reminder, China's non-performing debt is the one elephant in the room which nobody dares to touch, yet which CLSA briefly touched upon two weeks ago when it calculated that the real bad debt ratio in China is not 1.5% as per official "data" but really 8.1%. Needless to say, on $30 trillion in bank assets, this is a big problem.
But the one explanation that had not been provided, also happens to be the simplest one: Chinese consumers are simply not consuming! Luckily, we have insight into that as well, courtesy of the FT's Martin Sandbu:
As if on cue, the programmed slowdown in manufacturing, investment, and export growth is perfectly matched by a rise in domestic consumption, retail and services that leaves the total economy growth number just where the government said it would be. For example, industrial output is now reported to increase at 5.8 per cent, while the growth of the services share of GDP remains stable at 8.4 per cent.

The real sceptics go much further — and they have good arguments on their side which the optimists do not convincingly address. As the FT’s new EM Squared service pointed out last week, there are important holes in the shift-to-services story. One is that too much of the services growth is accounted for by finance, which is tricky to measure at the best of times, and whose reported robustness after the third-quarter market mayhem is outright unbelievable. Another is that income and wage growth, which presumably should be powering the supposed consumption and services boom, is slowing.
And the chart which hammers China's hard landing home:


There is simply no way to spin the above data in a favorable light, which we hope also answers Reuters' original question on China's empty malls. 
In fact, the only question after reading the above should be: "how long before China's consumption dysfunction leads to empty malls in the middle of the United States itself?"

Tuesday, June 23, 2015

27 images that prove that we are in danger

Sometimes every word is superfluous. These pictures say more than a thousand words.
http://bizlifes.net/discovery/855-27-images-that-prove-that-we-are-in-danger-7-left-my-mouth-open.html 
1. The view over the overdeveloped metropole of Mexico City (with more than 20 million inhabitants).
Pablo Lopez Luz
2. An elephant killed by poachers left to rot.
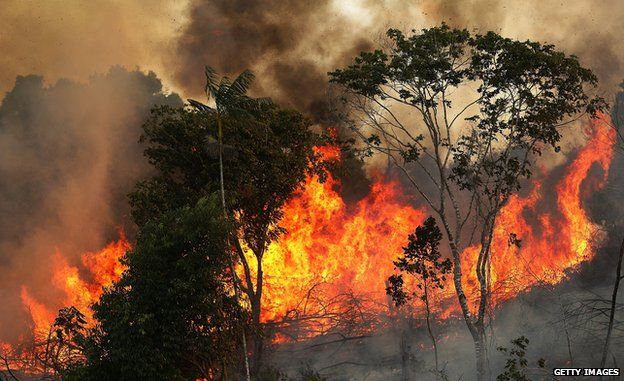
3. The rainforest in flames - goats used to graze here.
Daniel Beltra
4. Trails of excessive air traffic over London.
Ian Wylie
5. A massive truck delivers a load of oil sands for processing. Oil sand is considered the energy source of the future.
Garth Lentz
6. A simple herd farmer cannot withstand the stink of the Yellow River in Inner Mongolia.
Lu Guang
7. A waste incineration plant and its surroundings in Bangladesh
M.R. Hasasn
8. A fire storm plows through Colorado - increased incidences of wild fires is a result of climate change.
R.J. Sangosti/Denver Post
9. The scars left behind from the mining of oil sands in the Canadian province of Alberta.
Garth Lentz
10. A nighttime spectacle in downtown Los Angeles - the energy demand is incalculable.
Mike Hedge
11. In Oregon, this thousand year old forest fell victim to the chain saw for a new dam.
Daniel Dancer
12. The area around Almeria in Spain is littered with greenhouses as far as the eye can see - simply for a richly filled dinner table.
Yann Arthus Bertrand
13. Poachers pose proudly with the coat of a Siberian tiger.
Steve Morgan/Photofusion
14. The Mir Mine in Russia, the largest diamond mine in the world.
Google Earth/ 2014 Digital Globe
15. A dead albatross shows what happens when we litter. A living dumpster.
Chris Jordan
16. And yet another megatropolis - a bird’s eye view of New Delhi (over 22 million inhabitants).
Google Earth/2014 Digital Globe
17. Paradise almost lost: the Maldives, a popular vacation spot that is threatened by rising sea levels.
Peter Essick
18. The beginning of Black Friday at an electronics store in Boise, Idaho.
Darin Oswald/Idaho Statesman
19. Tons (literally) of broken electronics end up in developing countries and are stripped for precious metals by using deadly substances.
Peter Essick
20. The blunder of the Brazilian rain forest is being repeated here in Canada.
Garth Lentz
21. A landfill for worn-out tires in the desert of Nevada.
Daniel Dancer
22. While the entire world watched the events of Fukushima, a massive heat and power station was burning just a few miles away. All attempts to extinguish it where fruitless.
Mainichi Newspapers/AFLO
23. This polar bear starved to death in Svalvard, Norway. Disappearing ice caps are robbing polar bears of both their living space and food.
Ashley Cooper
24. To the last drop: an oilfield in California and the merciless overexploitation of humans.
Mark Gamba/Corbis
25. A massive waterfall from melting pack ice. These masses are the only meltwater and the undeniable proof how swiftly climate change is advancing.
Cotton Coulson/Keenpress
26. A lignite power plant contaminates the air with its discharges.
Jason Hawkes
27. The Indonesian surfer Dede Surinaya rides a wave of filth and trash (Java, Indonesia).
Zak Noyle
 
“When the Last Tree Is Cut Down, the Last Fish Eaten, and the Last Stream Poisoned, You Will Realize That You Cannot Eat Money.”
This prophecy is becoming a more and more brutal reality. But, even today, not every person is aware of the horrible effects our lifestyles have on nature. So share these evocative pictures with everyone.

Thursday, June 18, 2015

Pope Francis encyclical calls for end to fossil fuels

The Pope calls for a radical change in behaviour to save the planet for future generations
The Pope has issued an encyclical, calling for fossil fuels to be "progressively replaced without delay".
Pope Francis urges the richer world to make changes in lifestyle and energy consumption to avert the unprecedented destruction of the ecosystem.
Environmentalists hope the message will spur on nations ahead of the UN climate conference in Paris in December.
But parts of the document, leaked earlier this week, have already been criticised by some US conservatives.
It has been dismissed by two Republican presidential candidates.

Humans to blame

The encyclical, named "Laudato Si (Be Praised), On the Care of Our Common Home", aims to inspire everyone - not just Roman Catholics - to protect the Earth.
The 192-page letter, which is the highest level teaching document a pope can issue, lays much of the blame for global warming on human activities.
Pope Francis writes that: "We have come to see ourselves as her lords and masters, entitled to plunder her at will.
"The violence present in our hearts, wounded by sin, is also reflected in the symptoms of sickness evident in the soil, in the water, in the air and in all forms of life."

The letter highlights the loss of biodiversity in Amazonian rainforests and the melting of polar glaciers
He criticises what he calls a "collective selfishness", but says that there is still time to stop the damage, calling for an end to consumerism and greed.

'Moral approach'

Vatican spokesman Federico Lombardi launched the pontiff's second encyclical at a news conference on Thursday.
The teaching is more evidence of a pontiff determined to act as a catalyst for change, and a powerful diplomatic player on the world stage, says the BBC's religious affairs correspondent Caroline Wyatt.
The release comes six months before international leaders gather in Paris to try to seal a deal to reduce carbon emissions.
Metropolitan of Pergamon Joannis Zizioulas (left) became the first high-ranking Orthodox Church official to present a papal document
It has been widely welcomed by environmental groups, with WWF president Yolanda Kakabadse saying it "adds a much-needed moral approach'' to the debate on climate change.
Greenpeace leader Kumi Naidoo highlighted passages calling for policies that reduce carbon emissions, including by replacing fossil fuels with renewable energy.
But a leak of the document, published by Italy's L'Espresso magazine on Tuesday, got a frosty response from sceptical conservatives in America, including two Roman Catholic presidential candidates.
Jeb Bush said he did not get his economic policy from his bishops, cardinals or pope - so why his policy on the environment?
Meanwhile Rick Santorum questioned whether the Pope was credible on the issue of climate science.
However, many academics have welcomed the pontiff's input.
Prof Myles Allen, Professor of Geosystem Science at the University of Oxford in the UK, said: "If Pope Francis can't speak up for our unborn grandchildren, then God help us all."

Will Pope sway Americans? - Roger Harrabin, BBC News environment analyst

Jeb Bush dismissed a leaked draft of the encyclical
The UN's climate change chief Christiana Figueres says the Pope's message will influence talks in Paris this year on a deal to tackle global warming.
Developing countries are demanding firmer promises of financial help from rich countries so they can adapt to inevitable changes in the climate and get clean energy to avoid contributing to further warming.
Ms Figueres said their position would be strengthened by the Pope's insistence that this was the clear moral responsibility of the rich.
The encyclical will be welcomed by poor countries in Africa and Latin America.
The big question is how it will play in the USA, where it has already been dismissed by a Republican presidential candidate Jeb Bush, who is a Catholic.
Leading Republicans have warned the UN that they will undo President Barack Obama's climate policies - so if the encyclical sways any of the conservative Catholics in Congress that could prove significant.